The FGDI is the fractal dimension graph indicator (slight upgrade of the FDI fractal dimension indicator).
If the FGDI is lower than 1,5 level that means that the time series are persistent
If the FGDI is higher than 1,5 level than means that the times series are antipersistent
If the FGDI is equal to 1,5 there is a 50/50 probability.
The FGDI estimates the fractal dimension of the times series.
The fractal dimension = 2 - Exponent of Hurst (H)
So if the exponent of Hurst is equal to 0.5 we have a FGDI equal to 1,5.
Exponent of Hurst of 0.5 means that the movement is random without long term memory processes.
Exponent of Hurst > 0.5 - persistent
Exponent of Hurst < 0.5 - antipersistent
This is explained elsewhere and I just remember that basic stuff. The FGDI (FDI) according to me is better than the fractal dimension indicator published by Ehler, and moreover its mt4 implementation is not free but in the elite section of TSD.
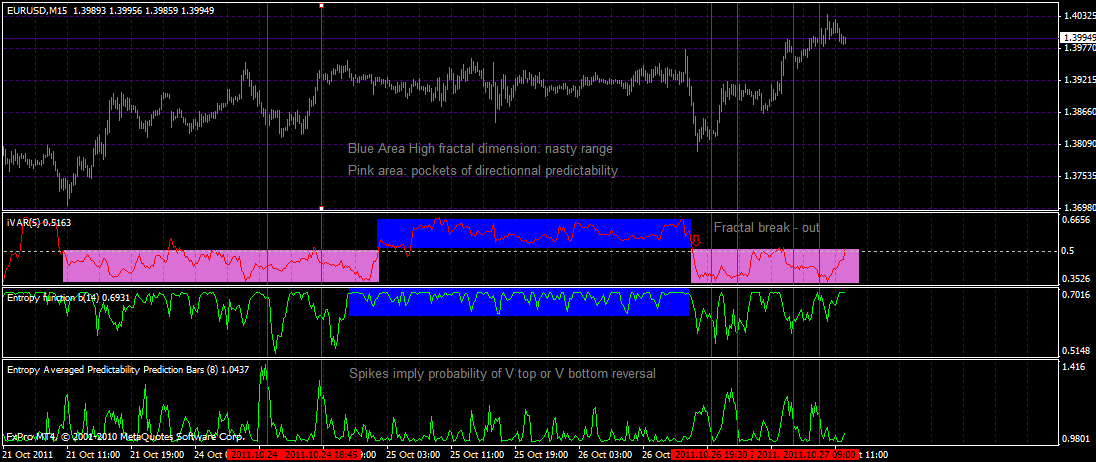
The IVAR is similar to the FDI but its scale is different. The center line is 0.5.
The interpretation is the same when it goes below 0,5 the movement is persistent and vice versa, it is antipersistent.
According to the statistical mechanics if the time series are random walk the H should be equal to 0.5.
Hurst has discovered that a lot of natural phenomena follow a "biased random walk" or trend with noise. The strength of the trend can be measured by how the Hurst exponent is above 0.5 (that means FDI and FGDI below 1,5 and Ivar below 0.5)
In fact all those formula are estimating the Hurst exponent. I think that the easiest is to understand the Rescaled range analysis as a method, to understand what is going on. I precise that I have no high education in mathematics and I was able to understand the logic.
The fundamental principle is if the time series are random their range will increase with the square root of time (this is original idea of Einstein in his paper for the Brownian motion). Einstein found that the distance a random particle travels increases with the square root of time used to measure it.
And Hurst decided to make a ration dividing the Range by the the standard deviation of the observations (R/S) R- range S - standard deviation.
So
R/S = (a*N)^H
R/S = rescaled range N = number of observations a = a constant H = Hurst exponent
So we expect to have H=0.5 if the price time series are random. But they are not folks, that does not mean that they are easily predictable either .
All this may seem very theoretical. The exponential moving average is either theoretical but easy to use. This is the same.
Няма коментари:
Публикуване на коментар