31.10.2011 г.

Characteristics of High Frequency Trading by Fredrik Henrikson

How to detect HFT?This is interesting paper about High Frequency Tradings. It is of a great interest and that is why I choose to upload it as a file and not to share as a link. The conlusions in this paper are not decisive. However there are some developments that merit a great deal of interest. In fact here you can find the explantion of several interesting and typical HFT strategies. They are described by Aldridge (2009).-

- Authomated liquidity provision- Market microstructure trading (less than1 m. holding period)

- Event arbitrage trading (less than 10 m. holding period)

-Statistical arbitrage (less than 1 h. holding period)

-Deviation arbitrage (less than 1 day holding period)

What is pinging? The HFT trader enters an order and then immediately cancels it in order to discover hidden liquidity.

What is spoofing? Entering a large number of orders on one side of the order book to give the
impression of liquidity and to trigger other algorithms while ultimately wanting to trade on the other side. The orders are then canceled and orders on the opposite side of the order book are entered

However the paper is mainly interesting in its developments how to detect the HFT trading. Even if I think that maybe the author does not use the most appropriate mathematical model to be used it is still very interesting.

The link to the PAPER is HERE.

27.10.2011 г.

WoW index is available on the bottom of my blog


The site of algofutures: http://algofutures.com/
This is a very interesting site. On this site you can monitor the order flow in some markets: S&P 500; Gold and Crude Oil.
What is this?
This is the WOW index. It has been created by Carl Weiss. The Weiss Index or as he call the WoW index monitors the order flow. The algogoup is deploying a R&D program trying to understand of how changes in Order Flow affect changes in Price. 
There are two signals:
1. There is a classification algorythm showing if the order flow is going up or down. Main idea, never fight the ticker.
2. The signals are coming when there is some divergence in the order flow momentum. Here I will cite Carl Weiss.
"Wo-Mo is proprietary class of algorithms developed by Algo Futures that monitor each transaction in a particular market and output streaming sets of values from which, the aggregated change in momentum of the ferocity and half-life of Buy and Sell program invocations can be inferred.
This ongoing ‘action and reaction’ activity within the automated trading environment is the major determinant of changes in Price in the short-term.
When the aggregated behavior of the automate program trading is aligned and congruent, trends are created.  When the behavior is chaotic, Price is chaotic.
The WOW Indices are composed from the outputs of some of our real-time SP 500, Dow 30, STOXX 50, & Crude electronic futures order flow momentum interpretation algorithms."
I would like to thank guandi for the link. Is it interesting? Yes it is. That is why I got to bed a 2:30 in the morning last night.
You can have a plugin in your site check how it looks like at the bottom of my blog.http://algofutures.com/

25.10.2011 г.

Time management. Are you a profitable trader? Hmm.... calculate your alternative costs !!!

Everybody talks about risk management and how important it is for your trading. But quite a few talk about time management.

And that is a very important and that concernes mainly the small non professional speculators.

I write here about it because I consider that this is very important.

The idea is that if you do not trade with big volumes the time spent trading becomes a concern. I mean it is a fact that the time has its own value. And if you want to be profitable you non only need to be profitale but you also need that the time spent trading is more worth as your alternative costs.

Yes time as a ressource has an alternative costs. I mean while you trade you spend time that can be spent elsewhere more profitably. How that concern the small speculators. Nobody talks about that but it is true if you have a small account you can't expect too much profit.

15 - 30 % return of capital on a year basis is very, very good achievement. So imagine you have 5000 USD account and you achieve 50 % return on capital. You would achieve a great success by any trading standrads. But it makes 2500 USD in your account. And imagine you have worked as a trader 10 hours per week. That makes 40 hours per month. And 480 hours per year to make 2500 USD.

And that makes you earn 5.2 USD per hour work. Well that is not much :(.

And in my country the minimum hour rate for my profession is 30 USD. So really what is the point. Maybe just the fact I like it. But calculate how much you are loosing while you are trading. From an economic point of view that is called alternative costs. Know your alternative costs at all costs!

The possible solutions are:

1. To trade larger and larger amounts. With larger and larger stress. That means to become a professional.

I have a lot of proffesionals who are here and have been invited by my, and semi-professionals as well. But most of the people who read this are not. And everybody cannot be a proffessional trader.

I have some psychological problems athat makes for me impossible to go to the next level. I just do not have the mentality to be a professional trader.

2. To keep it as a hobby and minimize the time spent on it.

That is the most important think. I will not develop the idea here but there are some times of the day that you can afford to trade and optimize the time spent on the markets.

3. To trade with larger time frames

That is my dream since a lot of time to design and implement that kind of strategy. I am still working on it. There are two variations: swing trading and position trading.

4. To automate the trading

Even if you cannot leave youe bot trading unsupervised it at least allows you to have multitasking while you are doing something else. That is a solution for the people in the on line business.

24.10.2011 г.

Dark pools: defense versus High Frequency Traders

This blog post is a continuation of the post Tree laws of the robotics and the High Frequency Trading.

The problem is that you cannot hide a big large institutionnal order from the High Frequency Traders. And if you try to execute that kind of order on the market place the High Frequency traders will jump on it and make the price much more expensive for the big institutionnal player.

Well how that works. So we have a bunch of high frequency trading robots all over the place. They are very different. Some are actively participating in the market making a lot of orders that are cancelled all the time with the purpous of detecting institutionnal volume and jump on it. Others are more passive and tehy scan through mathematical algorythms for opportunities and jump in only when the others detect something.

The result is when a large institution like a pension fund is buying the HFT are detecting it. And they jump on it. All this happens in split seconds. Then something onteresting happens that forms a pocket of predictability. This pocket of predictability attract other algorythmic traders even not necesseraly HFT. And then the machines start to have a very correlated behaviour and drive the prices in the direction of the big institutionnal player. And the intitutionnal player has to pay higner prices to buy the shares he wants to buy.

So what are the solutions from him. One of the solutions is to use himself a high frequency strategy in order to hide from the other high frequency algorythms. So there is a constant game of hiding and hunting at tremendous speeds that is going on the market.

The other solution for the big institutionnal player is to organize in dark pools. Those dark pools are traded secretely between only institutionnal players. And they do so because they do not want to affect the market, and get detected by the market.

Doing so they transfer shares between them at very competitive price.

However the regulators are looking them with very suspicious eye. Dark trading is not what a regulator may like. It is against the stock market logic.

But on the other hand the big institutions has to protect the interests of their shareholders. Imagine a pension fund, it is protecting the general interest. Why should they buy at the market place when they are certain to produce a big pocket of predictability that will be full in a milisecond with High Frequency Traders.

The other solution is to forbid the high frequency trading. Or to make a prohibitive tax. Well on this side the High Frequency traders are providing a liquidity.

The solution is not obvious. But in someway dark pools are protecting the market against flash crashes, provoked by high frequency nerds exploiting pockets of predictability

Here it is a video explaining really nicely what dark pools are.

21.10.2011 г.

The Law of the charts and the market state analysis

image

I made my picture of the law of the charts. It is not very beautiful but I will use it, because the market is giving text books examples only occasionally.

Here I notice the entry places according to the Law of the Charts. When I read for the first time I found it a little bit confusing but when you plot everything together is it much, much simpler.

OK. First we have 1-2-3 formation. This is when we have a down trend and how it transforms into an up trend. The market makes a low (1), then it goes higher (2) and then it fails to go lower than 1 (3).
There is a small concern with that conception. The problem is that it is not casual. Look at the 1-2-3 formation when it develops it is analysed as a Ross hook (Rh) but when the Ross hook failes it is analysed as 1-2-3 formation. And that is repainting. Anyway it is still usefull.


After that the market goes higher and makes a small correction. This correction is the central concern in the Law of the chart conceptions. The correction is called a Ross hook. And it is something in between trending and quit and trending and volatile in the market states conception.
image

OK. We have one little correction and then another. After that we have exactly the opposite 1-2-3 formation in the opposite formation. The market makes a new high (1), then it corrects (2), and then fails to go higher than 1 (3). After that we have new shallow Ross hooks.

You may ask how it is possible a man to call a simple correction in the market by his name. Really?
And even more he tells you if the market is not doing the structure you call it by your name it is not your time (or it was something like that). Now please pay a close attention. Yes it is possible to call this correction a Ross Hook because not every correction is a Ross Hook. He defines the rules in his law of the charts in a precise way but what I would like to point is different and it is connected with the market state analysis.
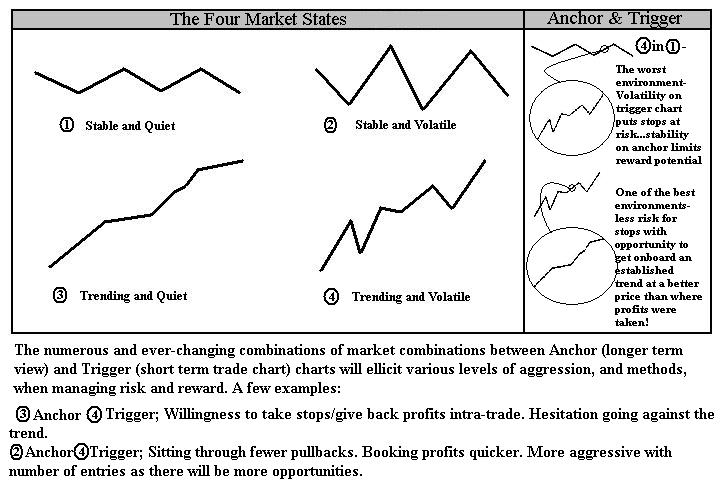
You have this kind of analysis when the market overall has the same structure. You need something in between trending and quiet and trending and volatile. This conceptions excludes the stable market states.

However look again at the first picture. Yes globally we can say that on a bigger frame it looks like stable and volatile (Anchor) and we have trending and volatile within (Trigger). The anchor and trigger is a very original conception that goes beyond the classical concept of triple screen analysis.

The key of the success using this i the correct interpreation of the current market state.

For Forex it is imporant to try to make your entry when you are in a period of increased volatility, Eurpean and London open and the New York open. The idea of Joe Ross for Forex is that you do not have to stay in front of your monitors all day. Just try to grab some pips for two hours and get out and do something else. You do not have to spent many hours at the fron of your screan to be a day trader.

There is however something more. Sometimes and occasionally the market is giving some big opportunities. And it is important to be there and cash in. I remember the particular moments from the bear market in the Euro. This kind of market is very well trades with the Joe Ross conception. And that is why when I hear for major problems in the Euro zone the speculator within me is happy. What I mean that in my experience the approariate conditions for the law of the charts is when we have a bear market in the Euro. The bull market is much more jagged.

And finally the Hurst Exponent is determing the probability of success of the Law of the charts trading method. The larger the exponent the probability of success is bigger.

18.10.2011 г.

Invitation by beathespread.com


I write here to invite my readers to join the community beathespread.com

You do not have to log in on order to download most of the things. However you are really welcome to join.
We are a small community but we have the desire to use only the best available instruments for trading.
I wanted to share what I know and what I have  in one particular place and to be able to communicate with my friends. There is a possibility fore creating private groups.

At beathespread.com we share the best we have. All great people are welcome. For the others we will manage somehow :).

14.10.2011 г.

The 3 Law of Robotics and algorithmic trading


As more and more tradign volume is carried by algorythmic trading we can ask if they do follow the three laws of the Robotics.

The Three Laws of Robotics ( shortened to The Three Laws or Three Laws) are a set of invented by Isaac Asimov. The rules were introduced in his 1942 short story "Tunaround". The Three Laws are:

1. A robot may not injure a human being or, through inaction, allow a human being to come to harm. 

2. A robot must obey the orders given to it by human beings, except where such orders would conflict with the First Law. 

3. A robot must protect its own existence as long as such protection does not conflict with the First or Second Laws.


Of course it does not make sense  in the algorythmic trading arena. However if we see the robots as a group they happen to have some upper lavel behavour as we human we have mass psychology. Robots have robot psychology. I will give again the same reference about the Rise of the machines: Federal Reserve Board.

"The empirical analysis provides several important insights. First, we find evidence that algorithmic trades tend to be correlated, suggesting that the algorithmic strategies used in the market are not as diverse as those used by non-algorithmic traders."

If we humans we do act as nerds the robots are super nerds. Here we have a shot about the flash crash in 2010.

"The joint report "portrayed a market so fragmented and fragile that a single large trade could send stocks into a sudden spiral,"[10] and detailed how a large mutual fund firm selling an unusually large number of E-Mini S&P 500 contracts first exhausted available buyers, and then how high-frequency traders (HFT) started aggressively selling, accelerating the effect of the mutual fund's selling and contributing to the sharp price declines that day."
source wikipedia

Algorythms were deeply involved in this process. Did their actions conflicted with the law of the robotics? And there is one more law of the robotics. The most important one.
  • 0. A robot may not harm humanity, or, by inaction, allow humanity to come to harm.
In our terms the robots may not harm the market.


When one robot finds a solution the other robots simultaniously are able to find the same solution And imagine if that happens on a time level unachievable for the human perception? The human eye and its brain interface, the human can process 10 to 12 separate images per second, perceiving them individually. The visual cortex holds onto one image for about one-fifteenth of a second, so if another image is received during that period an illusion of continuity is created, allowing a sequence of still images to give the impression of smooth motion.

So in a blink of an eye a lot of things happen we are completely unaware.

The idea in this metacognition technical analysis is that if the standard technical analysis have achieved a perfection in detecting mass psychology patterns today the trading arena is different. There are other players especially the algoryhmic traders that have a completely different behaviour that the human traders and investors.

13.10.2011 г.

Accumulation of orders: accumulation and distribution between market participants and market makers in the Forex market

Accumulation and distribution in the Forex market looks different from the distribution and accumulation in the Stocks. In Stocks there is a relationship between big players and the masses. However the advent of the high frequency algorithms complicated the game too much for the big guys.

In the Forex market there is another game between the masses and the liquidity suppliers. The accumulation distribution also occurs but it is somewhat different.

Check the whole article at beat the spread.

12.10.2011 г.

sequential signal patterns vs. parallel signal patterns

Recently I was visiting one very interesting thread.

There you can find a lot of information about neural net applications for Metatrader. I had also  some very interesting  private discussions and I have invited  some contributors and I am glad that they came at the traders' social network  beathespread.com.

It is really important to join the efforts. By the joined effort too much has been achieved by now. And it is not necessary to be an expert.

 http://www.trade2win.com/boards/metatrader/85780-build-neural-network-indicator-mt4-using-neuroshell.html

In the beginning of the thread you can find an interesting link which has inspired arriex for the whole thread. I was looking from other perspective to the same article  at tradertek
http://www.tradetrek.com/Education/w...n5forecast.asp

"neural network model that performs better than the human brain at recognizing "sequential signal patterns" such as stock prices, whereas the human brain is better at recognizing "parallel signal patterns"—the human eye can easily tell a picture of a tiger from a picture of a cat."

That is why I worked on elliottware and market state analysis. The human mind is very good at detecting market state changes "parallel signal patterns". What are those "parallel signal patterns" that we as humans can find it is all about that in the group of elliotware and market state analysis.

6.10.2011 г.

EUR/CHF Strategy

Here I would like to discuss a new strategy based on the fundamental situation in the EUR/CHF.
In fact three variations of the strategy have been prepared and released. One is freely available, the other two are only for looged in users in the site beathespread.com.

Actually the link is here. There is a group about expert advisors in Metatrader 4.

This is something very special as a strategy it is based on a fundamental situation on that pair. The fundamental situation is related with a statement of the Swiss National Bank that it will protect at all costs the level 1.20.
As a result a particular market states develops on that par. In that way a strategy was developed to extract pips from that market. Well I feel sorry we are late on since the expert was working at least for 10 days. And we do not expect that kind of strategies to work for long.

Fundamental calendar with Volatility Graph

I just added an addon to the site it is the news release information and Volatility graph of expected volatility.
This tool comes from Delta Stock and I thing this is the best free news calendar I have ever seen. The frist thing I really like is that you put your time zone. You never guess what is your relative time to the news release time. You can choose your language too.


The second thing I really like is the volatility graph in pips, how much exactly the news have historically moved the markets. And this is a very important information. And it plots the volatility not only to one pair you can choose the pair or the relevant index.


The other very good fundamental calendar is the Forex Factory fundamental calendar I really like it too. In Forex Factory fundamental calendar you can see another important information is how much the expectation diverged from the reality.

How to install a fundamental Forex calendar in Blogspot?

In fact you can add this calendar to your blog too it is just a matter to copy paste a piece of code. You can take the tool from here:

Then you can use the code. In blogger it is very easy.

1. Log in in your account.

2. Go to go to the design.

3. After add a new gadget,  you should use the gadget HTML/JavaScript gadget. I prefer to put the calendar as a gadget at the end of the template. Because only there I have enough place for it.

4. Copy the code from the Delta Stock web site to the HTML/JavaScript gadget.

And you are done. You have a fundamental calendar in your own site. Yes there is a little banner included but this is the price to pay ;).

4.10.2011 г.

Intuition and trading Forex and other speculative markets

Do you use properly your intuition in your trading? If you are successful the odds are that this is not up to your intuition.

This pictures is from the excellent book of Daryl Guppy trend trading. The picture may look somewhat complicated at the beginning. But can be easily understood. The are two things knowledge (x) and ability (y). You may expect somewhat a linear progression between knowledge and ability. The more you learn the better you will be. This progression is indicated by the line from the zero point to the right. Actually things do not happen like that .Of course at the beginning there is somewhat a linear progression from ground zero to reasonable skill and reasonable knowledge. There is a plateau of skills despite the progression of  knowledge. The more interesting is the more you learn as a chartist and technical analyst your ability to trade successfully is going lower. Guppy explains that by learning more and more patterns you will not succeed. He proposes to use a systematic method. He argues that the most successful traders are those that use a simple method that happen to be successful. The idea is that in actual trading should be executed using simple approaches (simple is a relative term, by simple I would understand systems that use a limited amount of inputs and transform them in outputs that is the trading decision (the mechanism of transformation is irrelevant to the simplicity e.g. a neural network using a limited amount of inputs can be considered a simple approach despite its mathematical complexity)).

However this chart can be analysed differently using our knowledge from the RV experiments.

Under the remote viewing approach you are all submerged in a constant flow of information they call that the matrix. The intuition may be called the ability to extract information bit by bit. The problem is that the analytical mind is trying constantly to fit this information into categories and bring sense to it. And most of the time this results in rubbish.

The paradox is the more you are knowledgeable in technical analyse the less you are able to use naturally your intuition. Yes that is a paradox because people believe that by learning more they would be more and more successful in the speculative markets. In fact this is not a thing about learning at all. You can't reasonably learn to predict chaotic time series, and get better and better. That is why I am ready to laugh when I listen somebody to announce, you need to learn to trade the markets. 

Well of course there are things to be learned and the most important is the money management. On the other hand the thing that you can't learn much does not mean that you do not have to work, because it is a really hard work designing and testing trading strategies. But people who think that be reading by heart the Encyclopedia of the Chart patterns that will make them masters are going in the wrong direction. Or others who think that they will observe a particular market and time frame for 300 hours and after that they will start doing magic are wrong too.

So if there is a paradox can something be done? The answer is yes it is possible they call it Associative Remote Viewing (ARV). This is a protocol specially designed to court-circuit the analytical overly in order to predict an apparently random event. However we mean the future, and as the future is probabilistic you have a probability not a certainty, and probabilities for the future are not necessarily the product of ARV. That leads to my conclusion that specific designed protocols of ARV can be a valuable tool but cannot be used as a sole trading tool. 

This is true for intelligence purpouses as Ed Dames say, yes Remote viewing gives results but you need at least other two intelligence sources in order to take action. As analogy for the markets that would be the same.