
30.12.2011 г.
28.12.2011 г.
Psychological mechanisms of manipulation: freezing and escalation of commitment effects in Forex Part 2

This is the Part 2 of the post about Psychological mechanisms of manipulation: freezing and escalation of commitment effects in Forex.
This article is to explain a patter closely related with the trader's psychology.
Take care with your commitments. The commitment to be a trader is a dagerous one. That commitment may lead you to some very dark places.
Take care with your commitments. The commitment to be a trader is a dagerous one. That commitment may lead you to some very dark places.
Honestly I can say the commitment to be a professional Individual Forex Trader is the worse thing you can do.
Why?
Because you are not prepared or at leat 95 % of the people who make those commitments are not prepared to do it.
As it is explained in the article the commitment to be a professional Forex Trader kicks in psychological mechanisms of engagement. Those mechanisme of engagement lead to escalation of engagement.
So combine this with the 95 % of probability that you are not prepared and you would have a very big probability of terrible loss.
If a proportion of the engaged are particularly vulnarable, psychologically and financially the drama is nearby.
The story of Igor is a typical example of commitment and escalation of engagement.
Without understanding the process of commitment, freezing and escalation of engagement this would be just a story, that just happened to somebody. Why this story would happen to you? What are the odds of that to happen.
Thanks to the social psychology we know that the odds are big, and they are against you.
OK what happens.
1. Igor makes a commitment to be a professional trader.
2. When you make a commitment you are engaged by your commitment. That is the key. You need to understand that at all costs.
3. Igor makes a mistake. In fact I think that that was not really a mistake whatever he explains for me it was a Black Swan effect a rare event that occurs rarely but when it occurs it blows you. It would be a mistake if he was the only one concerned, but he was not. After the fact it is easy to tell well I did a mistake that would not happen again.
4. What happens here it is important. A freezing occurs, he just can't let it go. He chooses to loose everything (family life) but not to give up trading. A deep personal drama develops a suicide is close. What happens?
The cold facts are that some traders really commit a suicide. And some of the best ever Jesse Lauriston Livermore
When he shots himserlf he writes his last letter:
“My dear Nina: Can’t help it. Things have been bad with me. I am tired of fighting. Can’t carry on any longer. This is the only way out. I am unworthy of your love. I am a failure. I am truly sorry, but this is the only way out for me. Love Laurie”
5. Igor gets a better trader, again in the game, but another rare event happens, and again he looses everything. You would say that he make a mistake, but on the other hand I will tell you that he would not make a single dollar in the market without taking the risks.
6. He is in a small appartment and starts to write on forum TSD. That is the result of the escalation of commitment and freezing, even if you know that you are wring there is no way back you are engaged in your commitment.
This part of the trading psychology is not wildly discussed. There are a lot of stories about that.
22.12.2011 г.
 The market state analysis is different from the Elliotware analysis. In the Elliotware we try to determine a constant market structure otpimize on that structure and hope that the solution we have will work out of sample. I have found such a structure on the 1h time frame on the EURUSD. Before that structure we made out of sample analysis on the uptrend with trading solutions. In those examples I used commercial systems (Trading Solutions and Neuroshell Day Trader) to make the analysis because they offered very good statistical evaluations of the trading systems so I could share the results.
On those examples as they were not rule based we used neural nets it was not possible to use robustness analysis. You know you really do not know what really does the Neural net, what really matters is what data you are going to feed to the net and how you are going to preprocess the data. The strenght of the commercial software is that it has some foolproof safeguards that avoid to the people who do not understand in neural nets to make big mistakes with the neural net parameters (As the Neural nets that are used are different Neuroshell uses some kind of cascade algorythms that adds more neurones as needed, and has a default limitation on the number of neurones limiting the possibilities of overoptimization, Trading solutions is worth because it helps you to follow the good practices for the ration betweensamples to weights ratio for better generalization).
The Market States Analysis
However this time I would make something different as I am using a rule based system of Brain Trend expert (you candownload it here if you haven't downloaded yet).

As it is a rule based system we are particularly interested in the optimization space and to find a global optimum.
The Alternation of Market States
There is something very interesting we can observe on the markets and that is the alternation between the market states. This is not magic of course we can have some theories why this occurs but I do not think I know exactly why it happens. The most probable explanation is as there are phases of accumulation of market orders those orders have to be activated. The transitions between accumulation and activation from a common technical analysis perspective is a break - out. You have a trading range and you have a break - out (the mother of all technical analysis strategies).
So basucally we do not have a two step process
accumulation - distribution
we hace probably a 3 step proces:
accumulation - activation - distribution
And as you can guess there is a very complex dynamics between the market states and the processes of accumulation - activation - distribution.
Well we know that most of the sharp impulses are due to cascade of running stops. There can be said a lot more. But let keep it simple right.
So take a look at this chart.

We had a trending and volatile market state, we had a technical break - out. What you could expect is an impulse. So what to do. It is possible to deploy a robust trading system for impuls environment. (By the way there was a change in the fractal dimension structure but I will avoid to comment this in this example I can say that we have also a fractal break - out a transition from a state of High Fractal dimension towards a state of lower fractal dimension).
And I deply on 3 different time frames the Brain Trend expert. This is not an out of sample analysis, this is the optimization space but as I optimize only 1 parameter it is not multidimensional (lol, simpler the better),
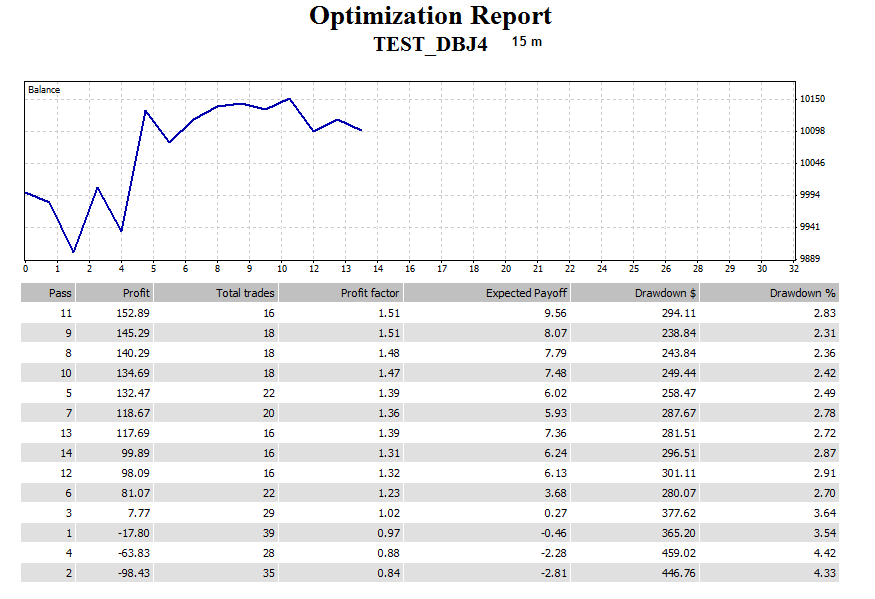


On this optimization report it is not shown but it is good you have to make the analysis by yourself using the optimizartion tester.
What is interesting is that the drow down is low. So you can set your risk level for example of 5 %. You will know immediately if you are right or not. Of course a visual inspection of the chart is very useful.
The advantage of playing a system in this manner over manually play the break - out is that a robust implulse following and momentum driven system will not let you go against the trend, even if the first break - out is fake, the system will know when and how to reverse.
21.12.2011 г.
Traders Anonymous®

As most of the retail traders are loosing money we can ask yourself do we really need something similar to Alcoholic Anonymous for traders.
That is why I created a group in our social network.
Traders Anonymous® is a fellowship of men and women who share their experience, strength and hope with each other that they may solve their common problem and help others to recover from trading alcoholism. The only requirement for membership is a desire to stop drinking (trading). There are no dues or fees for TA membership; we are self-supporting through our own contributions. TA is not allied with any sect, denomination, politics, organization or institution; does not wish to engage in any controversy, neither endorses nor opposes any causes.
Our primary purpose is to stay sober and help other traders alcoholics to achieve sobriety.
I think you with some sense of humour you will understand that. Those who lack it or are just too proud they can miss that. We just do not care.
Now seriously there is a Trading Alcoholism, it is called over-trading.
"If investing is entertaining, if you are having fun, you are probably not making any money. Good investing isboring." - George Soros
The successful traders I know are not treating trading as something exciting, it is a business, a hard business, the name of the game is money. If you are going to pay your bills you need to put those pips into your bank account. They have rock solid psyche. Really this business is not for everybody. When their system tells them to buy they buy. When their system tells them to sell they sell. That is it. And to have a robust system and to maintain the profitability of your system that is a damn hard everyday work.
Over-trading is dangerous, emotional over-trading is even more dangerous. It is trading alcoholism. This post about those who are sucked into the retail Forex. Please beware, unless you have several years of experience maybe you are going to loose your account, at least 90 % do.
So what can you do in order to fight the trading alcoholism or the over-trading?
1. Use mini lots of 0.01 lot.
2. Start to distribute your trades between the demo account and the real account.
14.12.2011 г.
Modern technical analysis or does the Dow Theory still holds?

I write this because I had some very deep doubts about the Dow theory in general.
I think that the Dow theory is a particular case of market behaviour and not the general way the markets will have to behave in the future.
Here I would like to add two screen shots on the daily chart of the EUR/USD.
Here I will only include two tenets of the theory:
I use exerts from the Wikipedia article with some minor comments.
1. The market has three movements
(1) The "main movement", this is the primary movement or major trend and it may last from less than a year to several years. The main movement can be bullish (we can say we have a bull market) or bearish (bear market).
(2) The "medium swing", is a secondary reaction or intermediate reaction (that means a counter trend movement or opposite of the main trend movement) may last from ten days to three months and generally retraces from 33% to 66% of the primary price change since the previous medium swing or start of the main movement.
(3) The "short swing" or minor movement it varies with opinion from hours to a month or more. Those three movements may be simultaneous, for instance, a daily minor movement in a bearish secondary reaction in a bullish primary movement.
In the modern talk we can say we have self similarity as nested elements. However at the time of Dow this vocabulary did not exist.
2. Market trends have three phases
Dow Theory asserts that major market trends are composed of three phases: an accumulation phase, a public participation phase, and a distribution phase. The accumulation phase (phase 1) is a period when investors "in the know" are actively buying (selling) stock against the general opinion of the market. During this phase, the stock price does not change much because these investors are in the minority demanding (absorbing) stock that the market at large is supplying (releasing). Eventually, the market catches on to these astute investors and a rapid price change occurs (phase 2). This occurs when trend followers and other technically oriented investors participate. This phase continues until rampant speculation occurs. At this point, the astute investors begin to distribute their holdings to the market (phase 3).
Look at the chart and in whic chart that holds true:


We see the primary trend, we see the secondary trend. We see the corrections. All that is very nice looking.
You may be a technical trader you are going to make it. If you are going to be a fundamental trader you are going to make it, I do not thing your fundamental analysis would favour taking positions against the trend. If you use a well diversified portfolio in the Stock market you are going to be very well money would keep coming in the bank.
We know that we cannot know the future we can make forecasts based on models, but if the very model is going wrong what is going to happen.
Look at the second chart now. Where is the trend. We have some kind of a different movement. With a minimum of imagination you are going to see trends. But comme on that second picture has nothing to do with the first one. Of course you can fit any market in the Dow model but doing so you may distort the reality and eventually that would affect your bank account in one way or another.
I think that if you want that your trading account and after all your bank account is healthy your models need to cope with reality. However the Dow Theory is a too breautiful model that we just cannot allow ourseles to let it die.
Heiken Ashi SSAep

This is a Heiken Ashi SSA ep. This is a mod of the Smoothed version of Heiken Ashi, however instead of using moving average for the smoothing we use End - pointed Singular Spectrum Analysis (SSA ep).
Basically we do Singular Spectrum Analysis with the High, Low, Open and Close.
Maybe you would like the result.
you can play with those parameters:
SSA lag: how many bars to use to compute the SSA window
SSA number of computations: This is the number of computations of the SSA
Number of bars ans first bars are used if you want to calculate the Heikin Ashi SSA for more history the default is 300
Trading Strategy
There is not a particular suggestion of a trading strategy, you can use it as an alternative for your own Heiken strategies, as Heiken Ashi is a very popular tool for technical analysis. You can pick what manual strategy you have in your toolbox and replace the Smoothed Heikin Ashi with this one.
On the shot you can see the indicator plotted on the daily chart on the pair EUR/USD, well even if you do not have any particular strategy it may tell you what currency to hold in your bank account. I mean that even if you are not a trader the currencies fluctuations affect your bank account. I think for this this may be a very usefull tool, you can use even the weekly bars.
The download link is here. There is a button on the right side of the page, just in case ;).
13.12.2011 г.
Tic Volume, Volatility Cycles, Market orders attack and most of all TIMING

In fact there are some books on VSA (Volume Spread Analysis) analysis, or we can in Forex call that TVSA (Tic Volume Spread Analysis). However there is a difference in my approach and the classic approach. I can say that the VSA analysis was a great tool for analysing crowd behaviour on the markets. Yes it was because the markets has changed. They changed because now first because they are globally interconnected. And there is a second thing still the crowd behaviour is a driving force tmarkets but there is something else. And this is the robot psychology. There is not only human psychology, there is a robot psychology too (welcome Isaac Asimov from the book I robot). As the automatic algorythmic strategies are a big player on the markets it is necessary to consider how they behave. There is a research book that mentions that the algorythmic strategies are much more correlated each other than the human strategies.
The empirical analysis provides several important insights. First, we find evidence that algorithmic trades tend to be correlated, suggesting that the algorithmic strategies used in the market are not as diverse as those used by non-algorithmic traders.
However as it is stated in the research paper.
Fifth, we find evidence that supports the recent literature that proposes to depart from the prevalent assumption that liquidity providers in limit order books are passive.
There are some things in the Oanda Open orders group. Here we can see the connection between the open orders and volume. Here We can see clearly that the spike in the volume has been provoqued by the simultanious activation of many orders. As we can see that some accumulation of orders work as attractors of the market action.

Fifth, we find evidence that supports the recent literature that proposes to depart from the prevalent assumption that liquidity providers in limit order books are passive :). This chart can be interpreted that a major level of orders was hit and that provoqued a spike in the tic volume. The next major level shows where the reversal can go if it is about to continue.
What is important is that when we see that the tic volume has clear oscillatory patterns we can see WHEN the next attack would be.


10.12.2011 г.
Brain Trend family of Systems
The logic of the brain trend is based on 3 key aspects:
A signal is generated whe we have a momentum + volatility break - out of a digitally filtered price over a momentum treshold.
The first aspect is the momentum
The Brain Trend needs a momentum computation in order to generate a signal for the trade. The momentum is computed using the Stochastic indicator. As the momentum often preceeds the price action this is a sound technical principle.
In fact it is possible to change the tresholds for the momentum manually.
In the privded expet we did not touch to this parameter. The default setting is a 9 period Stochastic for momentum computation.
As far as I understand we need a strong momentum in the direction of the price action in order to generate a signal. If we go up we need the momentum to go in the overbought area. If we seel we need the momentum to go in the oversold area.
The second aspect is the breaking of a volatility range
The momentum by itself is not sufficient in order to generate a signal A break - out over a determined range is needed.
The signal would be active only the price goes beyond a predetermined range. This part of the formula has never been touched. However as we know the volatility is changing all the time in the forex market and there are repeatable patterns of volatility I think that should be adapted.
There are many possible ways to determine the break - out. The core idea of the digital mods is to use not the price but a smoothed price in order to check if there is a break - over the predetermined range or not. The more smothed is the price the break above range level would be identified later. In fact this is the thing that is used to regulate the sensitivity of the filter and this was the main innovation of the digital brain trend mods. For example in the jurik JJMA versions we are not used the actual price but we are using the values of the filter. And we are looking for smoothing without delay and that is what the digital filters do in the digital Brain Trend. It was not very far the idea to use jurik everywhere in complex systems so that gave birth to a whole new generation of systems. However we can use everything that smoothes the prices without lag.
The third aspect is a volatility stop
This is a classic in the trend following systems. The idea is to slide the stop loss level point by point based on the current volatility in the trend.
2. The history of the advanced systems
A mystical guy appears on the cyrillic Russian alpari forum that uploades the first digital mod.
I tried to contact him in vain, the files have been edited by Larionov, and the JJMA library is of Kositsin, from the copyright information). There is has been for some years. Then I wanted to share with others as the Alprai forum was only in Russian and practically unaccessible to non cyrillic readers. I shared it both on Forex Factory and TSD. After that I started to to share private messages with some traders. This was Mr. Tools from TSD. And we discussed the possibility of putting different things instead of JJMA. I was thinking mainly about Fractally modified Jurik, the idea was to use more smoothing than general but to obtain a fast response when the market breaks out sharpy prvoquing a change in the fractally adaptive jurik smoothing filter.
He thaugt about using double smoothed jurik. And there are two versions that practically are different filters: mladen's version and the original kositsin version. That is how the new generation of brain trend was made.
After that logically I wanted an expert adviser in order to know the truth about the profitability of this system. In fact I use a simple rule, stop and reverse rule. Using that rules even if there were entries that were profitable before going negative at the reverse signal the expert prooved to be a good one.


I do not use the expert for trading I use for for knowing and optimizing the parameters. From this part it is
excellent, because the system appears very robust either it is profitable on all parameters either it is not profitable at all. The 30 minute frame on EUR/USD prooved to be the most profitable on the back test with almost every setting. The daily frame is profitable on almost every setting.
Lately I decide to disclose what I have here. This is a state of the art trend following strategy if used in its conventionnal way. Howver this should be mentionned we need a very carefull selection of the istrument we are going to trade. We need something that is making clear impulses, not necessary trending.

I always wanted to have a system able to profit from the Eur/Usd mega trends. Yes there are some really mega trends.
1. The COT report can be used as a valuable tool, indicator for a trend trending system profitting from the Eur/Usd megatrends. From one hand every day trader need to diversify through time frames on the other hand it is possible to have a nice system and to be in the game without the hard day to day analysis.
And as a trading system does not have to be difficult here there is a very simple system. Unfortunately there is one problem, there are quite a few opportunities per year.
First I would like to make a shot of the technical signals and the COT report. You know during that year there have been some very clear technical signals. And those signals have been confirmed by the COT report. Mainly we are tracking the big money.
Whe look what is the net position of the big Monney, large speculators. And we go with them. The signal is
-when there is a transition through the zero point.
-that happens to a place where there is a very clear technical analysis signal.
-we have aconfirmation with a trained system that gives us a signal.
On the other hand the other visual pattern is when the large speculators buy too much and the overbought level is reached. Then we could expect a reversal. Those moments are much more unpredictable.
9.12.2011 г.
Tic Volume, Fractal dimension and Volatility Cycles

Here I would like to add some observations. In the main article I described the Curtis Faith market states cycles. Here I would like to add some more insights.
Let start with the data. Here we can see a tic volume chart. On the tic volume chart we can see that there is a ciclicity in the in the tic volume.
The ATR cycles
The lower indicator is the ATR (Average True Range). This is a volatility indicator. We can see that the volatility is positively correlated with the Tic Volume. What is interesting is that we can see periodic cycles in the volatility as well.
The iVAR readings
Basic explanation once again (I repeat my self I know).
The lowest indicator is the iVAR. This is a fractal dimension indicator. Most of the readers here are really advanced but I will briefly explain what it means.
-iVAR below 0.5
The readings of this indicators of they are below 0.5 that means that the movement is persistent (there is a bigger probability that the next movement will be in the same direction as the previous). In our technical analysis context means that the next bar would go in the same direction as the previous. And that is really very important for every technical trader.
Why?
1. It is important if we play a break - out through a certain level.
2. It is important if we follow a lagging indicator. Even if the indicator is lagging it still will work because the next bar movement is in the same direction as the previous and the lag works for filtering the noise.
3. Basically brain trend excels in this kind of environment
-iVAR above 0.5
Basically this means that the movement is anti-persistent. The next movement will be in the opposite direction as the previous. From a technical analysis perspective that means that the next bar would be in the opposite direction than the previous.
However please do not confuse this with the technical analysis definitions of trend and range. This is something completely different. This is how the price series fulfill the space. Here I should explain that the iVAR is sgowing the same thing as the FDGI (fractal dimension graph index). However for FGDI it moves from 2 to 1, and iVAR moves from 1 to 0. The center line for FGDI is 1.5 for iVAR is 0.5.
More the iVAR is the inverse of the Hurst exponent (H) and FGDI (measuring the fractal dimension) = 2- H.
If the Hurst exponent os 0.51 the iVAR would be 0.49 and the FGDI would theoretically be 2-0.51= 1.49.
Anyway those exponents are not calculated they are estimated and different algorithms exist for that. And the probabilities they calculate are in practice very small, for example if iVAR has reading of 0.47. That means that there is 53 % of chance that the next movement would be in the same direction than the previous.
-iVAR at 0.5 level.
This means that the movement is totally stochastic the probability of going up or down is the same.
The iVAR cycles
It is important to mention that the iVAR has also cycles but it cycles are not going together with the volatility cycles. The fractal dimension cycles look like they lack any clear cyclic osclilatory pattern. However they have one very important feature. If they are antipersistent that will continue for some time than they will move lower and they will become persistent.
So We could combine this analysis with the volatility analysis and see when there is an increase of volatility. I mean when we expect the cyclic increase then we should pay attention in what fractal dimension cycle we are.
If we are clearly antipersistent. Please do not expect any impulse following algorythm to work well, as brain trend for example. But if we have a break out (readings of iVAR above the 0.5 are crossing the 0.5 line and going lower) we can be confident in ours impulse following systePublish Postms.
8.12.2011 г.
Phase Space Singularities

The fun thing is that the complexity of the phase Space is changing. Sometimes the phase space is relatively simple and sometimes it is really complex with its multidimensionality.
When the phase space is extremely simple we observe a Low Phase Space Singularity. When the phase space is extremely complex we see High Phase Space Singularity.
I call it singularity because the market dynamics start to be different from the normals market conditions.
Low phase space singularity. What is typical of that is that many different algorithms are able to find the same solution simultaneously and act accordingly. Is it an accident that the Brain trend, the ASCTrend stops with digital smoothing, the ASCtrend signal, the Trend magic with or without digital smoothing and the SSAsqueeze find simultaneously the same solution?
You see brain trend had good results, ASCTtrend had good results, Trend Magic had good results. A simple moving average will have good results. The human trader judgement is blown out the statistics may be blown out and we can go against the trend and can be hurt.
The idea is that when we have a relatively simple phase space of the possible solutions the algorithms are able to find simultaneously a solution. The algorithms are able to cooperate, but the humans we do not cooperate (one guy think it is oversold, the other it is overbought, one guy has long term horizon the other has short term).
And if FGDI (FDI) is in red (iVAR below 0.5) at both 15 and 30 m. time frame is a good approximation of the possible Low phase space singularity.


This Low phase space singularity is scary for the public policy makers, because all the market participants start to have the same horizon simultaneously. They are not able to adjust the economies to the market neither to guide the market as efficient as they would like.
They even may not have an idea what is going on and how their direct expensive interventions fail one after another on the Forex market.
Sometimes the Singularity goes into one direction, sometimes we have a series of ping - pong movements. All that is highly unpredictable several movements into the future, try to train a Neural Net to predict those market conditions and you will see, in fact whatever predicting algorithm you try to implement you will fail predicting the low phase space singularity. You have to react as quick and intelligent as possible, and even a SMA is good enough.
The High Phase Space Singularity is exactly the inverse phenomenon. The Phase Space is terribly complex: nobody is right. The market gos up and down up and down. In that type of market conditions the statistical methods are the best. The Gaussian model approximates very well the market during those times.
Fractal dimension patterns

Fractal break -out
Basically the ideal price movement is in a price channel. The price channel can be horizontal (range channel) or directional (trend channel). In fact it does not matter the type. When a price breaks the borders of a chart channel we have a break - out of the channel. If that happens we have a probability that the market conditions has changed and the price will further go away from the channel.
The channel can be regular but it can be irregular. All the classifications of the channels is in fact the technical analysis.
A channel defines a trading range. We have up limits and down limits of the channel. You need at least two points from above and from below to draw a price channel. Then just draw a line connecting the up limits and the down limits of the channel.
Well, but when the prices goes beyond the channel and the gets back to the channel often the technical guys will tell you that you have drawn the channels improperly and you need more educations. When you get more education you will draw the lines properly but again you will see the prices go beyond the channel and get back to the channel. As in the avatar the pilot says before going to battle Ain't that a shit.
This is called a false break - out that happens more often that we want to admit (50 % of the cases ). Ain't that a shit again?
Anyway My idea is to get new details how to trade a Break - out.
1. Use of the volatility probability
We have a break - out probability in periods of increased volatility. So it is necessary to check statistically the volatility. This is well known by the professional players. On the net there are studies with the volatility. Usually we expect a break - out during the open of the European Session and the US session
2. Use of fractal indicators FGDI, IVAR, FDI
We use a fractal dimension graph index indicator (FGDI). When a breakout occurs it is accompanied with a change of the fractal state of the price series.
That means that the graph goes from a state of high fractal dimension to a state of low fractal dimension. We have a shift in the internal structure of the price time series.
2.1 Fractal Break - out
Conditions: We are at a blue zone with fractal dimension greater than 1.5. We move to a zone below 1.5. This is a fractal breakout
This is usually observed after a range (FGDI greater than 1,5)
2.2 Fractal Break - in
We are at a red zone, fractal dimension less than 1,5. The fractal dimension get lower.
I call it so because we are in a red zone of low fractal dimension and the fractal dimension gets lower.
This is usually observed in an established trend when we have a breakout in the direction of the trend.
So when we have a lower fractal dimension the movement is persistent. There is a bigger probability that the next movement will be in the direction of the previous. So when there is a reversal, the reversal tends to be quick and abrupt (Black noise). So that explains how the V tops and V bottoms are formed.
On the other hand when the fractal dimension is higher than 1.5 we have a bigger probability that the next movement will be in the opposite direction.
And the price goes up and down in a lot of oscillations. There we can find pink noise, a lot of whipsaws up and down.
If the price time series were random there would be no correlation of each movement with the previous movement.
I can give a lot of examples of this. This approach is different and independent from the TA perspective so it combines really well with it.
H - Hurst exponent
When H = 0,5 the FGDI = 1,5
Pink noise 00.5
Black noise 0,5
See chapter 13: Fractional noise ans R/S Analysis
From the book fractal market analysis.
The best use of the system is when there is a low dimension in both two key levels 15 and 30.
If we have red on both 15 and 30 time frame our Persistent Movement Roller Coaster can begin . We will show to the old guys how we can pick tops and bottoms. If we have on both 15 and 30 time frame high fractal dimension that means that the phase space is deemed to be too complex. I call it high phase space singularity.The phase space is so complex that nobody is right. The price goes high and low like crazy.
3. A peak in the Hurst Difference
Well this is a kind of measure of the change of the transition of the fractal dimension from one state to the other.
This is a new indicator find in the code base of mql. So the idea is to measure the rate of change of the Hurst Exponent. A high peak means that something is going on.
Fractal dimension indicators and their use
The FGDI is the fractal dimension graph indicator (slight upgrade of the FDI fractal dimension indicator).
If the FGDI is lower than 1,5 level that means that the time series are persistent
If the FGDI is higher than 1,5 level than means that the times series are antipersistent
If the FGDI is equal to 1,5 there is a 50/50 probability.
The FGDI estimates the fractal dimension of the times series.
The fractal dimension = 2 - Exponent of Hurst (H)
So if the exponent of Hurst is equal to 0.5 we have a FGDI equal to 1,5.
Exponent of Hurst of 0.5 means that the movement is random without long term memory processes.
Exponent of Hurst > 0.5 - persistent
Exponent of Hurst < 0.5 - antipersistent
This is explained elsewhere and I just remember that basic stuff. The FGDI (FDI) according to me is better than the fractal dimension indicator published by Ehler, and moreover its mt4 implementation is not free but in the elite section of TSD.
The IVAR is similar to the FDI but its scale is different. The center line is 0.5.
The interpretation is the same when it goes below 0,5 the movement is persistent and vice versa, it is antipersistent.
According to the statistical mechanics if the time series are random walk the H should be equal to 0.5.
Hurst has discovered that a lot of natural phenomena follow a "biased random walk" or trend with noise. The strength of the trend can be measured by how the Hurst exponent is above 0.5 (that means FDI and FGDI below 1,5 and Ivar below 0.5)
In fact all those formula are estimating the Hurst exponent. I think that the easiest is to understand the Rescaled range analysis as a method, to understand what is going on. I precise that I have no high education in mathematics and I was able to understand the logic.
The fundamental principle is if the time series are random their range will increase with the square root of time (this is original idea of Einstein in his paper for the Brownian motion). Einstein found that the distance a random particle travels increases with the square root of time used to measure it.
And Hurst decided to make a ration dividing the Range by the the standard deviation of the observations (R/S) R- range S - standard deviation.
So
R/S = (a*N)^H
R/S = rescaled range N = number of observations a = a constant H = Hurst exponent
So we expect to have H=0.5 if the price time series are random. But they are not folks, that does not mean that they are easily predictable either .
All this may seem very theoretical. The exponential moving average is either theoretical but easy to use. This is the same.
6.12.2011 г.

When I think about Elliott Wave I feel sentimental and nostalgic about my first book of technical analysis where the author was promissing 90 % chances of success. I did not get the 90 %, not even near. I had the impression that the trading is something you have to learn and you make it. If I was realizing how much effort I was going to put into this I think I would do something else. However it is my child's dream and so that is why I am here.
The traditonal approach of this author was that there is something...sure and this sure thing was E...W....ve. Then he gavve many examples how Prechter predicted the bull, market, the bear market etc. The predictions by Neely etc. Then I realized OK they do so and they find themself very often wrong. In the same time the ASCTrend and the Brain trend on daily graphics make a very, very good predictions about the big bear market and the bull market etc. The ASCtrend and the Digital Brain Trend predicted the crisis VERY accurately.
So what is the point of Elliot wave if a software makes a better prediction. I think that this analysis has something that a purely mechanical approach can miss. I mean what interests me most is the transition from one market state to another. And this knowledge can prove very usefull when trading a mechanical trading system.
Imagine you are working into a trend with clear impulses. Suddenly the market starts shifting its behaviour. What are we planning to do? To see how the profits vanish and accepting that the losses were initially calculated in the system or to stay away and to try to analyse the current market behaviour with Elliott wave principle.
The Elliott wave principle lacks badly for prediction of market direction. I can give countlees professional examples about counter trend market predicions based on Elliott Wave principle.
The mechanical trading systems are very bad at predicting the market conditions. In fact the true strenght of the Elliott wave principle is to predict the volatility and the the underlying market action. How much it is going to continue and when it would start to do something else.
For example somewhere in August on the EUR/USD the market became erratic. The ASCT Trend systems and its trend following families started to loose like crazy. I think that turned out a normal seasonal market feature. Under Elliott wave principle that could be analysed as a very, very complex XWZXZW ranging pattern. The antipersistence was so bad that every counting effort appeared to me pointless.
However we know that after that kind of market action a new storng impulse is on its way. Can you predict the direction the impusle is going to take? Me, No thanks. This is a job for fundamental traders not me.
The traditional Elliotis would try to predict the market direction based on counts. But those people do not realize that this lacks somewhat a practical sense in Forex. The future global predidctions based on counts are for stocks (I do not develop here why but the Elliot wave theory was based on a game theory approach).
Another thing. The actual drop in the Gold. Well we see that there is a drop. And the market behaviour shifts. The bear market has a different behaviout than the bull market. Is it going to be stupid to use a Neural Net trained partly on bear market and partly on bull market?
Is it possible to say for sure how much the market is going to fall? Where it is going to stop? I do not know.
I know I that the market characteristics has changed. So identify with Elliott waves principle where that happened exactly and start training the experts and the training models in general on the new market conditions.
Maybe I could be wrong but this is my hypothesis.
Human brain and parallel signal patterns

They claim that their Pipelined Recurrent Neural Network performs better than the the human brain recognizing sequential signal patterns such as stock prices.
Of course the beginning of 2000 that was the explositon of the idea that Artificial Learning algorythms are the holy grail. There are many commercial and free softwares available. Of course the obvious idea is to have a model for yourself. By now this is accessible to everybody, you can download and test arryex things or you cand download and test the Back Propagation Neural Networ (BPNN) with a whole library of inputs (SSA Caterpilar, Hodrick- Preskott, Jurik type of digital filtering, Volume Weighted Average Price VWAP, etc. etc.). However you will not get any edge.
The think is and there is the second part of the article.
whereas the human brain is better at recognizing "parallel signal patterns"—the human eye can easily tell a picture of a tiger from a picture of a cat.
And that I think is important. And that is why I try to make use of human pattern recognition tools that would be able to add an edge in Neural Net applications for trading purpouses. The first approach is the Elliotware but I also try another approaches as the Market State Analysis.
Using neural net models newbies should be very carefull. It may be boring but I have to say. Look at your fundamental calendar, do not be surprised, the market orders accumulation is also not accounted in the pattersn on which is trained the neural net. And there are so many things that are not in the model, so do not expect much from it.
It performs well when it is trained on the current market activity and you expect a microstructure event (I do not expect any neural net to predict a major top and bottom) provided nothing serious is happening right now. Just make sure of that.
I really liked too much a phrase from quantin123 it is not necessarily a joke:
Always keep in mind that NN is just a dumb calculator.
Elliottware In a nutshell

The idea is about similarity. The Elliott Wave theory is very precise about identification of the market stages. Here and by now I would assume that you have an understanding what it is.
For example we have a trend pattern. The market behaves in a trendy way. We can isolate this period and use it for training window. It would be a non sense (well in my perspective) to use the range that precedes the break - out to train the expert (or the neural net what ever). Well we may not have sufficiant data but the data we would have woul lead to a robust solution.
There is a problem more we have data with precise the same market conditions we expact that the change in the market conditions is imminent.
A lot of data for optimization - less robust (the market is expected to change)
Quite a few optimization data (e.g. we just had a break - out) - quite robust (we expect that the new market conditions are likely to continue).
The ideas for the Lyapunov exponent should be added here. There is a constant loss of information as the market is chaotic, that should be taken into account.
There are other ways to make an optimization for example some want to make a more global training that takes into account both trending and ranging patterns. This can be done easily using the Elliott Wave theory. We can on the past data isolate quite sucessuflly 5 impulse followed by correction. LOL
1. The firts training range will be the immediate visible count wave.
2. The second training range would be the bigger wave.
3. The third training range would be the previous wave.
4. The last would be the biggest wave.
Practical limitations in the Neural net extrapolation
 |
| neural net, extrapolation |
Those zones are known as decision zones. That means that there a decision has to be made.
And this is analogy with the principle of uncertainly (a quote from wikipedia).
In quantum mechanics, the Heisenberg uncertainty principle states a fundamental limit on the accuracy with which certain pairs of physical properties of a particle, such as position and momentum, cannot be simultaneously known. In other words, the more precisely one property is measured, the less precisely the other can be controlled, determined, or known.
Well this is just an analogy. In technical analysis when we are closer to such a decision zone. The scenarios are clearly measured and predetermined. The price is either doing this or that. But if we know precusely the scenarios we do not know the actual direction.
And vice-versa when we are away from those decision zones. We may know very well the general direction of the market but we have not a clue of the trajectories.
And in that particular situation the Neural Net by their extrapolating abilities are giving us a help. When the direction is clear but the scenarios are unclear.
If you are clearly near a decision zone the performance of the neural net will depend more on luck than other things.
Here I woul like to post my shot. Here we have two scenarios. Those scenarios are clearly cut. One is going high, the other is goind down to the channel. From the downside of the channel a new decision has to be made.
I used BPNN Caterpillar with the same training period on 30 m time frame. Both of the BPNN was with lag bars 40. However one had 3 computations the other 5. One of the nets was pointing high the other low.
I mean a slight change of the inputs and we have a totally different prediction. I think if we consider a decision zone it is normal. Basically what inputs will you use and the outcome is based on luck.
5.12.2011 г.
Interesting self similarity at The EURUSD macro-trend technical analysis
 |
| Macro Technical analysis of EUR/USD |
It is really interesting to observe big peaks followed by little but very sharp peaks.
What the future is going to be? Whatever they can say about the Euro it is not that low. Definitely it can go lower at least historically there is enough space to go 1.30 or 1.20.
On the other hand the long frame technical analyisis showes to us that we are right into a very important decision zone. Yeah right now we are at a decision level and what is going to happen now is going to affect the pair for the future.
Абонамент за:
Публикации (Atom)