12.06.2013 г.

V-Entropy: hybrid Entropy Hurst exponent indicator

This indicator is based on the article Tracing of stock market long term trend by information efficiency measures by Virgilijus Sakalauskas & Dalia Kriksciuniene

The entropy-based (EB) indicator is designed by aggregating SE and HE, and is defined by the following expression (4):

EB= 1/2 - (1/2 - HE)*(1-SE)


where HE is the Hurst exponent value and SE is the Shannon’s entropy value.

In case of randomness of the time series, HE=0.5 or SE=1, then the indicator EB is equal to 0.5 and characterizes the time series as the white noise process.

In all the other cases EB indicator can take any value from [0,1] and characterizes persistent series by EB values greater than 0.5, and antipersistent series by values lower than 0.5, similarly to Hurst exponent.

The main difference of aggregated indicator EB from HE is achieved by adding influence of SE values. If S value approaches to 1, but H value is significantly different from 0.5, the compound value of EB will be much nearer to 0.5 than H value. And vice versa, if H value is near 0.5, but S is significantly different from 1, the EB value is stronger shifted from 0.5.

The indicator EB aggregating HE and SE as defined by expression (4), can be considered as time series long range dependence measure and applied for defining the revolving moment of time series trend direction.

We further analyze if this measure can be particularly useful for prediction.

The indicator is called V-Entropy because one of the authors of the article is called Virgilijus Sakalauskas.

DOWNLOAD for logged members.


8.05.2013 г.

How to trade the market states with discretionary trading?


I was asked a question how to trade the market states from discretionary perspective. This turned out to be a very complex question. Every school of technical analysis (or price action) incorporates some kind of market state detection method. The basic market state classification comes from Curtis Faith. So maybe it would be a good start to read his book about the turtles method.

However I am not satisfied with that answer. I think that everything depends on the level of understanding of the trader. If an experienced trader is reading those materials he would not ask this question because he will figure out by himself if this is an usefull stuff for him or not.

Howevewer let consider we have been asked by a novice trader. I think that it would be nice if he gets some knowledge of the basic tenets of technical analysis and price action in the first place.

For this reason we made a special group about price action where we have collected some links. The group is called Price action and pattern trading with statistic edge. Here I recommend the law of the charts by Joe Ross. He has his own method of market states identification but you can compare it with our classification that is upgraded with fractal dimension and scales (read Anchor and Trigger).

Basically Joe Ross uses the concepts of ledges and consolidations as ranging patterns. Please read the law of the charts page 8.

What Joe Ross does is that he makes from theoretical point of book very simple connection between the market state and the logical entries. Have a look for his method of Trader's trick entry. After reading this you would have a better understanding after the identification of the market state where the entries are.

This method is quite different from the classical technical analysis. The classical technical analysis methods rely on a very specific patterns that are related with the changes of volatility (heteroscedasticity) and accumulation of orders. When the volatility slows down the market tend to draw the typical technical analysis figures. During this process order start to accumulate and they are triggered afterwards. During this process break - out levels are detected and exploited by market technicians. Every technician has a method of market state identification, the most basic one is to distinguish two states a trending state and range state. When the trending state is detected it is preferred to use moving averages, when the ranging is detected the oscillators are more appropriate tools because they do not lag. However from there many others questions and uncertainties arise that I can't summarize here because it is complex I want to mention that always different scales are examined by the analyst, have a look of the Triple screen method byAlexander Elders.

And finally, last but not least it was revealed the relationship between the market states and with the accumulation of open orders and market states. This is very visible in the EUR/USD. You can check this link. This was intended basically as an upgrade of the Price Volume analysis.

So this is what has been developped here and we hope it is a valid market knowledge you can use in your own research. For the beginners I ask them to start start with Joe Ross as the most simple introduction in price action. It is worth even if you deal with EA trading because EA trading and discretionary trading share a common aspect: the ability to appreciate if your trading method (manual or authomatic) is able to perform on the current market state.

12.04.2013 г.

The Real Significance of the Bitcoin Boom (and Bust)


1 billion vanished in 7 hours! Brutal! Bitcoin market some days ago as within just hours went from 229 to 266, the next 7 hours suffered defeat, even unseen since the craze bubble in Amsterdam on the East India Company, tulips and stock market crashes in Paris and London by 1720.

From $ 226 to $ 105 and if the market capitalization is it reached $ 2 billion, then about $ 1 billion in heaven. By MTGox main market which traded currency announced that the decline is due to problems in handling the large number of transactions.

What is going on?

In this article they have an interesting view on the problem. Provided that some insiders are expecting 1 bitcoin to reach in the future $10 000, $100 000 or even $1 000 000 the current fluctuations are really insignificant.

But still this is a great story to follow. When guys I mentionned this on this forum, this may have been one of the best speculations in your life. Anyway from technical perspective this market is much more prone to analysis by the methods of technical analysis than the traditional markets and currency markets.

However on the other hand a bulgarian technical analyst states that the bitcoin is very risky and he gives some decisive arguments.

As in 2011 the question arises, what would do the merchants who accept payments in Bitcoin? If you make a deal with currency you have no idea if you would be in profit or loss only minutes after the deal.

For the customers pops the question - Buying a product, you may wonder whether you would acquire it ten times its value in other currencies, or extremely profitable.


In this case, it is difficult to hedge on both sides, especially in retail. Thus, the issue of Bitcoin currency touched again to trust.

So a new market arises and technical analyst Karadjov makes his technical estimates:

"Wrote on Apr 08 Bitcoin - where?!, I gave a level of $ 195. Exactly $ 195 turned, dropped to only $ 176, but it went to $ 266, before yesterday's debacle. It is difficult to give just any performance, but in my opinion the currency will drop to at least $ 41 if not much lower. Do not forget that it was also much lower, below $ 2, in a very recent past."

22.02.2013 г.

Robust Control Paradigm for Trading

http://www.engr.wisc.edu/ece/faculty/barmish_ross/ifac_trading_barmish.pdf

Abstract:

The objective of this paper is describe a new paradigm for the trading of equities. In our formulation, the control corresponds to a feedback law which modulates the amount invested I(t) in stock over time. The controller also includes a saturation limit Imax corresponding to a limit on the value at risk. The admissible stock price evolution p(t) over time is modelled as a family P of uncertain inputs against which we seek robust returns. Motivated by the fact that back-testing of candidate trading strategies involves significant cost and effort associated with computational simulation over sufficiently diverse markets, our paradigm involves the notion of synthetic prices and some idealizations involving the volatility of prices and trading liquidity. Our point of view is that a robust performance certification in this somewhat idealized market setting serves as a filter to determine if a trading strategy is worthy of the considerable time and expense associated with full-scale back-testing. The paper also includes a description of a so-called saturation reset controller. This controller is used to illustrate how the model works in practice and the attainment of robustness objectives over various sub-classes of P.

Author: B. Ross Barmish

Here you can watch a video.


19.02.2013 г.

Weekly EUR/USD analysis: February 18- 22

Recently it was a good practice to make the weekly analysis starting from what happened on the markets of Monday, in that way Monday being the leading day of the week. This week I am quite late. However as the market is still in consolidation between 1.33 and 1.34 from the beginning of the week it is worth to post my support and resistence levels.

Resistence:

Major levels: 1.34, 1.35, 1,36

Secondary levels: 1.345,1.355,1365

Support:

Major levels: 1.33, 1.32, 1.31

Secondary levels: 1.325, 1.315

According to dailyfx analitist David Rodriguez the level of 1.32 is a key level rearding the strenght of the trend of EUR/USD. This conforms our analysis from the  last week when we mentioned  that We have many clusters of support below the market at 1.32 and 1.325.

Technically we have a channel clearly visible on the daily frame. And we are on its lower limit. From technical perspective that would mean that the market is forced to make a choice.

Choice 1: Going back to the channel

Choice 2: Getting out of the linear regression channel

The question is what can be the catalyst of this choice. Based on recent developments this would be some fundamental news. Recently the market on EURUSD was event driven. So More predictable economic event risk can produce the volatility and they would be concentrated on Wednesday and Thursday when US CPI and PPI inflation figures are due and when the minutes will appear from the most recent US Federal Open Market Committee (FOMC) meeting.


15.02.2013 г.

Price action and indicators

"The markets behave much like an opponent who is trying to teach you to trade poorly"

Eckhardt

The price bar is an indicator, it is wrong to separate the price bars from the indicators.

A price bar is sampling the market action in a time period and is indicating:Open,High,Low,Close.
This is an indicator per se. The Japanese candle sticks offer particularly good representations,on the other hand they are wider taking more place than the bar charts.

As Protagoras says "man is the measure of all things". And from human perspective it is important when using discretionary analysis to use the same settings, only in that way you can train your mind with the market patterns.

Price bars are robust because they do not allow you to change their settings inside your time horizon, and in that respect they allow human traders to train them-self to recognize patterns (according to their logical  price action strategy).

Most newcomers when they use technical indicators they try to manually and randomly fine tune them on past market history and by doing this they do curve fitting and by this they do not train their mind to recognize patterns as they change the inputs all the time.

(System traders they also do back-testing but machine back testing is precise and they do precise walk forward optimizations trying to avoid data mining bias as much as they can, they use many other validating techniques to challenge their system).

On the other side it is a massive disease to see on public forums screens full of indicators, which settings are changing all the time.

And of course, the best technical analysis authors when they use indicators they do not change their settings. They use the same settings for years. For example the alligator of Bill Williams or the indicators of Dinapoli indicators set, or Elder, there are much examples. What they search for robust indicators which do not produce tremendously different results by small changes in their parameters.

The core idea is to train the mind the relationship between the market and the indicator values on the most deep unconscious level by following some basic framework rules. It is the mind that does the job (transforming the indicator input into actionable trading signals) not the indicators.

In fact this works like training a neural network and this takes a lot of time. It is difficult because humans have many psychological limitations. That is why the education is not only intellectual but also on the emotional level the so called emotional intelligence.

And that can be achieved by human by looking at the same indicators again and again. It is advisable not to have much more than 3 indicators at all.

14.02.2013 г.

The Forex Grid on EUR/USD

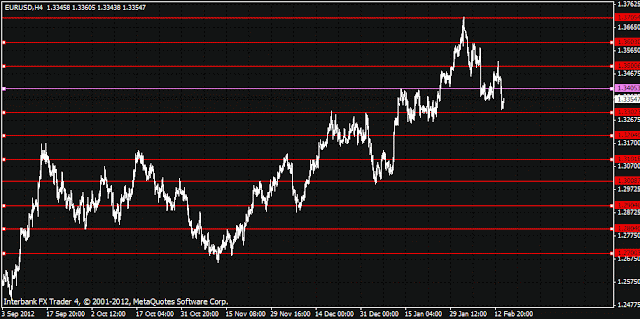
I will post here a screenshot about the Forex grid on EUR/USD. The future support and resistance zones are in the order-books. In order to get the whole idea about support and resistance it is important to have a look in the order books not only at the charts.

The prices very often overshoot the true support and resistance levels and that adds a lot of confusion leading to large errors in support and resistance identification relying only on charts.

The charts are often very misleading with lots and lots of fake technical patterns. Very dangerous are the patterns which rely on projections of volatility like projections of contracting of volatility.

Some of the supports and resistances are related with purely statistical limitations of the current price action.

However the practice is difficult, as the price series are fractal even if you put support and residence in random places you will find matches, and a lot of matches.

The primary support and resistance levels are at round numbers at every 100 pips. 
At every 50 pips are the secondary support and resistance levels.

At the first shot have a look at the Oanda order book.


At the second shot have a look at the EUR/USD chart with plotted horizontal lines at round numbers.


10.02.2013 г.

Weekly EUR/USD analysis: February 11 - 15

Now I am going to be very brief because I really do not want you to think that is a service I will provide.

I think now that we really again we do need to see the daily candle of Monday in order to see what the market will be for the next week.

As for monday there is 50/50 chance that the market will go to 1.33 or to 1.34.

As the market was correcting last week it is hard to predict where the correction will end.I quite agree with the weekly analysis of forexempire that on EURUSD we are in only buy market.

The recent extreme and directional market movements are closely related with fundamental statements and data. One of the main reasons that we fell last week was related with some precise statements by Mario Draghi after the ECB conference 07.02.2012. He warned that the high value of the euro was a risk to growth in the Eurozone.

However as you can remember the euro began its recent sharp rally following positive remarks by ECB head Mario Draghi about the Eurozone economy.

How can you see this. A possible answer is there is some kind of macroeconomic agenda about how fast the Euro should rise and any sharper upside movement is seen as a threat.

For more information go to beathespread.com


6.02.2013 г.

Smooth Commodity Channel Index

Here is a screen shot of a new Smooth CCI mod. I was looking again at the formula of the CCI, Check this mod too. The CCI smooth is a continuation of the previous release.

Here is the formula of CCI:

CCI = (Typical Price - 20-period SMA of TP) / (.015 x Mean Deviation) 

In the previous mod I questionned the constant of 0.015. The CCI was created by Lambert. And he had the idea to use a multiplier 0.015, so as a result 70% to 80 % of the price action would remain within -1oo and +100. However we should focus on what his adea was, and you need to change this number to make fit 70% to 80 % of the price action within the levels -100 and 100.


I think you understand much better this indicator now.However this time we can go one step further and not use a difference between 

Typical Price - 20-period SMA of TP      but something else:

5-period EMA of TP - 20-period SMA of TP for example. In this way you can get much smoother CCI without adding any complexity to the indicator. What counts is that the major turns are without much lag.

And this indicator allows to build different derivative indicators and possibly to smooth them.

The indicator has three settings:

CCI period - this is the CCI period
CCI Period 1 - This is the period used for the moving average period (we use moving average instead of raw price)
level- the level is used to determine how far the indicator line will go above and below zero, basically this is a scaling parameter. The default is of course 0.015.


Download from here, only for registered users.

3.02.2013 г.

Weekly EUR/USD analysis: February 4 - 8

EUR/USD had a strong upward momentum last week and made a substantial 1.3 % climb hitting a 14 month high. Despite the fact that the movement was a textbook break – out from the consolidation area between 1.325 and 1.34, the sharp rise took the majority of the human traders by surprise. The rise trapped many traders. 

From a technical perspective the question is if this pair would show some exhaustion patterns? For this reason the first trading day of the week will be of paramount importance. After such a sharp rise the daily candle of 04.02.2013 will be very important. 

The recent market fluctuations were closely related with the fundamental releases. In the weak ahead many fundamentally important events are scheduled to take place, that would lead potentially to a lot of volatility. 


Trading outlook: 

The trading outlook is difficult this week, the pair is in an uptrend having incredibly strong momentum and fundamentals. This situation is difficult for the majority of human players who are actually trapped in their short positions. 

As the pair is strong not only from technical but also from fundamental perspective the best solution would be to exit at the first correction, in that respect a reversal doji after Monday would be  great news. 

As for the entry in the direction of the trend, I would say that this is difficult if you want to have close stops. 

A break – out above the last week close at 1.37 would be a good break - out entry, and potentially a trade for at least 50 pips up to 1.375. 


Main Weekly Resistence : 1.38

Main Weekly Support :1.34, 1.35


29.01.2013 г.

The Human herd and the Wisdom of the Crowd

Thanks to some web platforms we can see now over the net the Retail Sentiment.

Why this would be important?

I think that this is important because according to data from 2011: Retail FX is big business. Average daily turnover across the industry from retail traders is approaching the $200bn mark, a sizeable chunk of a $4 trillion a day global market (source).

At a first glance $200bn mark compared to the $4 trillion a day global market does not seem big. However when you combine this information with several other facts:

The information that 98 % of the volume in FX is speculatvie and only 2 % is fundamentally driven.

To move the EURUSD by 0.2 percent, a trade of 200 Mio
USD needs to be made, which requires as little as 5 Mio USD in terms of equity (source).

That means that this retail flow when acts as a herd (and it acts so very often) is able to produce certain market movements and reactions too.

Right now I will give you some screenshot so you can see the momentary picture from retail human herd directional bias.


От Oanda open orders


От Oanda open orders


От Oanda open orders

As you can see from those shots they are samples from the population of the hypothetical human herd.

Yes that exists humans in fact are acting as a herd on the markets, they open positions as a herd and they move their stops at specific places.

That makes the whole technical analysis tools of support and resistence work. I believe that machine order flow can't produce support and resistence by itself in the same way the humans do (this is a pure hypothesis).

From the screen shots you can see that the humans are acting as a herd and roughly the same ratios appear at two independant retail platforms: Oanda and Dukaskopy. Those two ratios are confirmed by the eToro traders insight.

However there is something even more interesting.

The advent of social sharing makes this even more pronounced. In eToro there are leading tradiers (most influential traders) and they are even more bearish than the normal herd.


От Oanda open orders


Check this shot, there you can see the top traders insight.

The most advanced forms of technical analysis schools always have emphasized patterns between retail traiders order flow (uninformed traders) versus the institutional orderflow (informed traders).

You can see for example the VSA (Volume Spread Analysis) and the the articles of Sam Seiden. However they use the limited tools available from the chart (open, high, low close and volume), and the natural support and resistence zones.

Here in this blog post I am trying to show you a direct observation of this phenomenon and to show that the herd activity is real and can be observed directly. The samples from Oanda, and Dukaskopy are sufficiently representive.

In another blog post I may show you how this happens regarding to the price and how the human herd adjusts itself acting like a real herd.

From there it is obvious for me that what masses do matters, but profiting from the herd slaughter I think is way too simplistic. You can check this article. There has been succesful instruments of improving the dynamics of the group. "Matches between traders and recommendations were based on an innovative algorithm designed to optimize information flow within the network. Even this small number of coupons was enough to move the entire network away from dangerously high levels of “groupthink,."

Is there a wisdom of the Crowd? Can you profit from that information and how?

18.01.2013 г.

Chaos and complex representations for neuroevolution

In this article on my blog I summarized  my views on the proper way to obtain a robust solution through neroevolution.

Basically I question the whole architecture of the neuron when you are going to use  genetic optimization or particle swarm optimization.

I suggest a different architecture, in this architecture we replace the transfer function by more complex mathematical representation and we evolve the weights inside. Doing so we are able to boost the power of the neural network.  


The use of the logistic map as a very complex mathematical representation allow to add much more power to the neural net. By tuning the parameters (r) we can add a portion of chaos and by this  improve the robustness. 


This architecture is useful when no global solution exist and we face multiple local optima. In such case we want to find  practical but robust solution.


What is the basic idea of this neuron architecture. The basic idea is that we are not looking for a global optimum at all. Why? Because we know that this global optimum does not exist.

I would refer to the Hitchiker's guide to universe:

"Narrator: There is a theory which states that if ever anyone discovers exactly what the Universe is for (I replace with the market) and why it is here, it will instantly disappear and be replaced by something even more bizarre and inexplicable. There is another theory which states that this has already happened."

So we know that we have multiple local optima, and no global optimum at all. In fact to find a local optimum is not a problem at all. What we are looking for is to find a stable solution. And that stable solution can be achieved only if you let the genetic optimizer evolve the weights into a complex mathematical space.

So let see what is all about.

The use of genetic algorithm for training SVM models is not something new. Let start from the standard artificial neuron model. However we are going to do something different. We are not going to map the inputs into a multidimensional space. We are going to put the agents into multidimensional space.

The first thing to do is to have a look a the basic structure of the artificial neuron model. I think the relevant Wikipedia article is a very good reference:

"For a given artificial neuron, let there be m + 1 inputs with signals x0 through xm and weights w0 through wm. Usually, the x0 input is assigned the value +1, which makes it a bias input withwk0 = bk. This leaves only m actual inputs to the neuron: from x1 to xm.

The output of kth neuron is:
y_k =  \varphi \left( \sum_{j=0}^m w_{kj} x_j \right)
Where (phi) is the transfer function.

Artificial neuron.png


The output is analogous to the axon of a biological neuron, and its value propagates to input of the next layer, through a synapse. It may also exit the system, possibly as part of an output vector.

It has no learning process as such. Its transfer function, weights are calculated and threshold value are predetermined."

So this is the basic neuron model and different learning methods can be applied.

A research paper was proposing a another possible structure making the traditional neuron model more complex."The basic idea is in representing the weights, that belong to interconnections in the neural network, by function. The learning process then doesn't happen directly on the level of weights like it is common in normal neural networks, but instead it happens by changing the function that is used to generate the weight  every time when its value is needed."

The resulting neural network is called Hyper neural network. In the paper two approaches are used the representation of a function as a compressed matrix of coefficients used for Inverse Discrete Cosine transformation and representation of a function a a tree composed of elemental operations.

Another possibility is to make something different. We can vary the value of the weight using the formula of a transfer function and by this we may eliminate the use of a transfer function. We can  vary and optimize the weight (using transfer function formula).

In the theoretically the biologically inspired neural networks, there the activation function is an abstraction it represents the rate of action potential firing in the cell. However we may not need this abstraction for some practical problems.

By doing this we diverge from the general neural model. The question is what we can gain from that? What are we going to do?

The simplest thing is to use simple transfer functions and vary them (here we will generate a population from the transfer function), then to multiply the result to the input and that is the output.

In the normal model in its simplest form you take the input you multiply by the weight then you input this result within the transfer function to get the response.

However here you can do something different. You can use complex representations and generate populations from them.

You can watch the video in this link to see a practical implementation of approximation of function by genetic algorithm using the Trading Software Metatrader 5. You can read more how the software works on this link.

Then the learning happens on the level of the transfer function. You may vary also the weights too but here we will not do so.


 This is the Gaussian function. On the next picture you can see how the genetic algorithm approximate that.


From this the neuron model will look like this:


double perceptron()
  {
     double weight1 =  MathExp(gamma*(-x1*x1-y1*y1));
     double weight2 =  MathExp(gamma*(-x2*x2-y2*y2));

 
    double input1 = iCustom(TimeFrame,Symbol(),"PFE",x5,true,5,0,0);
    double input2 = iCustom(TimeFrame,Symbol(),"PFE",x6,true,5,0,0);
    double input3= iCustom(TimeFrame,Symbol(),"PFE",x7,true,5,0,0);
    double input3= iCustom(TimeFrame,Symbol(),"PFE",x8,true,5,0,0);

   return ( weight1* input1 +  weight1* input2 +  weight2*input3 + weight2* input4);
  }


-We use the genetic algorithm to vary the values of the weights:
x1, x2,y1,y2

-You can modify at will the architecture

-This model is different from the classical neuron model. We do not have a transfer function. By doing this we eliminate the need of transfer function, you can add it but it is not necessary.

However we can use even more complex representations: We can use the logistic map as a complex space and vary the parameters of the logistic map.


(1)\qquad x_{n+1} = r x_n (1-x_n)

That is the equation of the logistic map.

What is interesting for us is the parameter r. If we vary the parameter we will have different behaviour (sensitivity of the initial conditions). I keep it short here but we can get some very interesting stretching-and-folding structures.
image

image


image
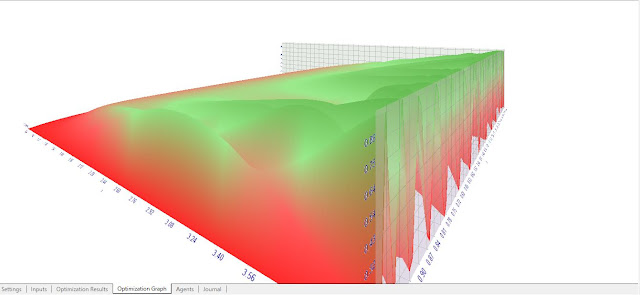
This is 3d picture of the logistic map. Logistic map as a kernel function. Why not?

We have a very complex representations from a very simple formula and the properties of the logistic map are well known.


  Here we use:


- RECURRENT DIFFERENCE EQUATION: the code is simple however the recurrence is not supported by OpenCL by now.

- TO USE SOME PORTION OF CHAOS: this can be obtained by varying the value of r approximately 3.57 is the onset of chaos, so we can limit from 1 to 3, if we want to add some chaose we can go from 1 to 4 . The use of noise in the neural net training is a common pragmatic approach to increase the robustness of the solution. The x value os from 0.001 to 1 with step size of 0.001 for example. We can vary the number of iterations (limitmap) to as a parameter. As a result we get something terribly complex.

The idea here is that there is not a global optimum and we do not want to find it. It is counter - intuitive.


A sample code of this using the mql4 language (the language is based on C) is like this:


double weight1()
{
double w, j;

w=(r*x*(1-x));
for(j=0;j<=limitmap;j++)
{
w=(r*w*(1-w));
}
return (w);
}

double weight2()
{
double z, i;

z=(r1*x1*(1-x1));
for(i=0;i<=limitmap1;i++)
{
z=(r1*z*(1-z));
}
return (z);
}


double perceptron()
 {
//---
   {
 
   double p1 = iCustom(NULL,0,"PFE",x5,true,5,0,0);// those are inputs
   double p2 = iCustom(NULL,0,"PFE",x6,true,5,0,0);
   double p3 = iCustom(NULL,0,"PFE",x7,true,5,0,0);
   double p4 = iCustom(NULL,0,"PFE",x8,true,5,0,0);
  }

  return(weight1()* p1 + weight1()* p2 + weight2()*p3 + weight2()* p4);
  }


16.01.2013 г.

Why all those complex Artificial intelligence models fail predicting the markets?

The point as I see it is that predicting the markets using any AI brute force (force method in the sense of relying on the abilities of the algorithm by itself) is a dicey business.

The markets are terribly complex they constantly are looking for balance and falling out of balance. The markets are so terribly complex that you may wander if the complex learning paradigms can beat the buy and hold on one hand and the simple linear regression on the other. Most of the time they can't pass the Monte Carlo simulations.

If that was not the case every AI specialist would find easily his way to riches. The problem is not in the AI methods they work fine on normal problems. The slight nuance is that you are asking them to do impossible things. As they can't let you without an answer they will give you an answer to the question as it is in the book Hitchiker guide to the galaxy. They asked a very complex computer what is the purpous of life and the answer was 42.


So the direct and brute force approach of successful and sound and proven AI do not work consistently enough.

So what can be done. From one hand those guys are hired by the HF quantshops where an edge is found in the speed of execution. Then the edge needs deep infrastructure understanding and market structure understanding that are completely different fields of knowledge. Only by combining this meta knowledge those quant shops succeed.

Other possible way is to look towards econometrics and deep market knowledge. Then you may be able to find a good definition of the problem and apply correctly the model. The economist need to define the problem the AI specialist has to apply correctly the model.

Those are two main models I know that lead to an edge. There may be other ways in order to beat the markets but they are fringe like entropy analysis, market states clustering and chaos theory etc.

So then why people do stay?

One possible answer is that beyond profitability the quest is very interesting per se, you learn new things, it is an excellent "game" for smart people. Eventually you find good on-line friends to work together on projects thinking that the grail is right next on the corner. Everything will be fine unless you allow yourself to make a gross loss.

Start small start smart. Take it easy.

14.01.2013 г.

Weekly EUR/USD analysis 14-18

The EUR/USD is now at the same levels that it was in april 2011. That makes a 9 month high. The last week the Euro was up by 2 %.

After the European conference Mr. Mario Draghi made a statement that he sees signs of euro zone economic stabilization, after those statements the volatility rized sharply and the EUR/USD rised with more than 170 pips. There have been also some postive bond auctions in Spain and Italy.

A daily close above 1.3310 confirmed the current medium uptrend. From technical analysis perpsective we see clearly a bullish bias if the Euro is able to sustain momentum.

Even if we have a clear bullish bias we do not recommend deep stops at this moment much below 1.333 for short term traders. As everything depends on the momentum I waited the beginning of the London session in order to publish this weekly analysis.


Despite the fact that the technical analysis is the domain of what you see and not about what you think I advise extreme caution right now. I think that a short term correction is due from those levels and that the market can't sustain momentum easily. I see a possible correction towards 1.30. From that perspective for medium term traders I can recommend either a very short stop just below 1.320 betting for increase of momentum or a deeper stop below 1.30.

Main Weekly Resistence 1.35

Main Weekly Support 1.322, 1.30


5.01.2013 г.

Eureka: genetic programming software

http://creativemachines.cornell.edu/eureqa

Eureqa (pronounced "eureka") is a software tool for detecting equations and hidden mathematical relationships in your data. Its goal is to identify the simplest mathematical formulas which could describe the underlying mechanisms that produced the data. Eureqa is free to download and use.

This software essentially does the same job as the commercial chaos hunter application however the commercial application also transfers the generated mathematical formulas to the trading plateforms.

Here you need to figure out how to do that on your own.

Anyway the simplest thing that can be done is to model the current trend for example.

Here I would suggest for reading two interesting articles:

What will cause the Singularity? : this is very interesting article it appears that Eureka is an oustanding genetic programming software: “That’s a pretty big deal in the world of evolutionary algorithms”

Product review of Chaos hunter from traders.com : this a basic article about the practical use of the genetic programming software in trading strategies: two methods the definition of a treshold or boolean strategy.

Let me summarize in a simple way the neural nets can do the same job as the genetic programming. However the Neural nets will store their solution as a data set of weights that has no meaning for a human. The genetic software forces that the solution is described by mathematical formulas that a human can understand. And that is why so much hype is there in the scientific community.

This is genetic programming, the algorithm evolve basic equations in order to achieve the best fit. As a result we have equations that we can understand and not weights.


In that way you can understand the results. For example if you do the same thing with a neural net you will get weights and if you run the model you will get predictions but you will never know the idea behind even if basically the prediction is the current close ;).


2.01.2013 г.

Weekly EUR/USD analysis 02.01.2013

EUR/USD is currently in a tight consolidation area between 1.3155 and 1.3310. The 1.3155 level is the support, and the 1.33 level is the resistance.

We can expect for the next week a heavy fundamental flow to force an increase of volatility in the pair as the Fiscal cliff deal is heading to House after Senate vote.

A daily close above 1.3310 would confirm the current medium uptrend. The pair is very likely to test the short term resistence level at 1.33. Any downards movement is expected to be capped at the level 1.3.

A daily close below 1.3 would negate the current upward momentum in the EURUSD.

Long term outlook: flat market with complex consolidation patterns

Medium term outlook: unconfirmed up trend with support levels 1.30 and 1.27

Short term outlook: up trend: support: 1.31 resistence: 1.3355

Asirikuy’s First MT4 Genetic Programming Implementation

The search come to me because of a link share in linkedin with a link of advanced trading software developpers arguing the use of genetic programming. This is the original link from linkedin.

The bookmark link here is interesting. It is about using genetic programming instead of genetic optimization in building trading strategies.

So what is it about? Let start start with Wikipedia:

"In artificial intelligence, genetic programming (GP) is an evolutionary algorithm-based methodology inspired by biological evolution to find computer programs that perform a user-defined task. It is a specialization of genetic algorithms (GA) where each individual is a computer program. It is a machine learning technique used to optimize a population of computer programs according to a fitness landscape determined by a program's ability to perform a given computational task."

So the question arise who did that in metatrader. So there are some answers.

There is a commercial software: the genetic builder software. This page on their site is very interesting explaining how this stuff works. The site is very informative and you have a clear idea what you are paying for.

And there is asirikuys' implementation. I hope I could see that but the service is available under a paid subscription.