 |
I made my picture of the law of the charts. It is not very beautiful but I will use it, because the market is giving text books examples only occasionally.
Here I notice the entry places according to the Law of the Charts. When I read for the first time I found it a little bit confusing but when you plot everything together is it much, much simpler.
OK. First we have 1-2-3 formation. This is when we have a down trend and how it transforms into an up trend. The market makes a low (1), then it goes higher (2) and then it fails to go lower than 1 (3).
There is a small concern with that conception. The problem is that it is not casual. Look at the 1-2-3 formation when it develops it is analysed as a Ross hook (Rh) but when the Ross hook failes it is analysed as 1-2-3 formation. And that is repainting. Anyway it is still usefull.
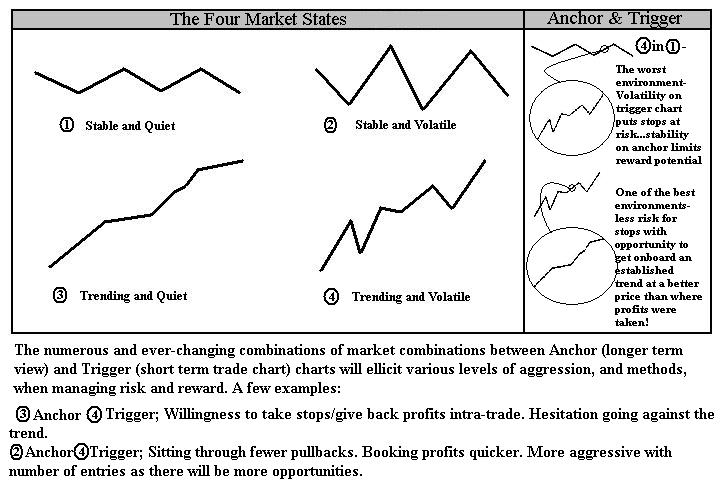
After that the market goes higher and makes a small correction. This correction is the central concern in the Law of the chart conceptions. The correction is called a Ross hook. And it is something in between trending and quit and trending and volatile in the market states conception.
 |
OK. We have one little correction and then another. After that we have exactly the opposite 1-2-3 formation in the opposite formation. The market makes a new high (1), then it corrects (2), and then fails to go higher than 1 (3). After that we have new shallow Ross hooks.
You may ask how it is possible a man to call a simple correction in the market by his name. Really?
And even more he tells you if the market is not doing the structure you call it by your name it is not your time (or it was something like that). Now please pay a close attention. Yes it is possible to call this correction a Ross Hook because not every correction is a Ross Hook. He defines the rules in his law of the charts in a precise way but what I would like to point is different and it is connected with the market state analysis.
You have this kind of analysis when the market overall has the same structure. You need something in between trending and quiet and trending and volatile. This conceptions excludes the stable market states.
However look again at the first picture. Yes globally we can say that on a bigger frame it looks like stable and volatile (Anchor) and we have trending and volatile within (Trigger). The anchor and trigger is a very original conception that goes beyond the classical concept of triple screen analysis.
The key of the success using this i the correct interpreation of the current market state.
For Forex it is imporant to try to make your entry when you are in a period of increased volatility, Eurpean and London open and the New York open. The idea of Joe Ross for Forex is that you do not have to stay in front of your monitors all day. Just try to grab some pips for two hours and get out and do something else. You do not have to spent many hours at the fron of your screan to be a day trader.
There is however something more. Sometimes and occasionally the market is giving some big opportunities. And it is important to be there and cash in. I remember the particular moments from the bear market in the Euro. This kind of market is very well trades with the Joe Ross conception. And that is why when I hear for major problems in the Euro zone the speculator within me is happy. What I mean that in my experience the approariate conditions for the law of the charts is when we have a bear market in the Euro. The bull market is much more jagged.
And finally the Hurst Exponent is determing the probability of success of the Law of the charts trading method. The larger the exponent the probability of success is bigger.
Няма коментари:
Публикуване на коментар