22.02.2013 г.

Robust Control Paradigm for Trading

http://www.engr.wisc.edu/ece/faculty/barmish_ross/ifac_trading_barmish.pdf

Abstract:

The objective of this paper is describe a new paradigm for the trading of equities. In our formulation, the control corresponds to a feedback law which modulates the amount invested I(t) in stock over time. The controller also includes a saturation limit Imax corresponding to a limit on the value at risk. The admissible stock price evolution p(t) over time is modelled as a family P of uncertain inputs against which we seek robust returns. Motivated by the fact that back-testing of candidate trading strategies involves significant cost and effort associated with computational simulation over sufficiently diverse markets, our paradigm involves the notion of synthetic prices and some idealizations involving the volatility of prices and trading liquidity. Our point of view is that a robust performance certification in this somewhat idealized market setting serves as a filter to determine if a trading strategy is worthy of the considerable time and expense associated with full-scale back-testing. The paper also includes a description of a so-called saturation reset controller. This controller is used to illustrate how the model works in practice and the attainment of robustness objectives over various sub-classes of P.

Author: B. Ross Barmish

Here you can watch a video.


19.02.2013 г.

Weekly EUR/USD analysis: February 18- 22

Recently it was a good practice to make the weekly analysis starting from what happened on the markets of Monday, in that way Monday being the leading day of the week. This week I am quite late. However as the market is still in consolidation between 1.33 and 1.34 from the beginning of the week it is worth to post my support and resistence levels.

Resistence:

Major levels: 1.34, 1.35, 1,36

Secondary levels: 1.345,1.355,1365

Support:

Major levels: 1.33, 1.32, 1.31

Secondary levels: 1.325, 1.315

According to dailyfx analitist David Rodriguez the level of 1.32 is a key level rearding the strenght of the trend of EUR/USD. This conforms our analysis from the  last week when we mentioned  that We have many clusters of support below the market at 1.32 and 1.325.

Technically we have a channel clearly visible on the daily frame. And we are on its lower limit. From technical perspective that would mean that the market is forced to make a choice.

Choice 1: Going back to the channel

Choice 2: Getting out of the linear regression channel

The question is what can be the catalyst of this choice. Based on recent developments this would be some fundamental news. Recently the market on EURUSD was event driven. So More predictable economic event risk can produce the volatility and they would be concentrated on Wednesday and Thursday when US CPI and PPI inflation figures are due and when the minutes will appear from the most recent US Federal Open Market Committee (FOMC) meeting.


15.02.2013 г.

Price action and indicators

"The markets behave much like an opponent who is trying to teach you to trade poorly"

Eckhardt

The price bar is an indicator, it is wrong to separate the price bars from the indicators.

A price bar is sampling the market action in a time period and is indicating:Open,High,Low,Close.
This is an indicator per se. The Japanese candle sticks offer particularly good representations,on the other hand they are wider taking more place than the bar charts.

As Protagoras says "man is the measure of all things". And from human perspective it is important when using discretionary analysis to use the same settings, only in that way you can train your mind with the market patterns.

Price bars are robust because they do not allow you to change their settings inside your time horizon, and in that respect they allow human traders to train them-self to recognize patterns (according to their logical  price action strategy).

Most newcomers when they use technical indicators they try to manually and randomly fine tune them on past market history and by doing this they do curve fitting and by this they do not train their mind to recognize patterns as they change the inputs all the time.

(System traders they also do back-testing but machine back testing is precise and they do precise walk forward optimizations trying to avoid data mining bias as much as they can, they use many other validating techniques to challenge their system).

On the other side it is a massive disease to see on public forums screens full of indicators, which settings are changing all the time.

And of course, the best technical analysis authors when they use indicators they do not change their settings. They use the same settings for years. For example the alligator of Bill Williams or the indicators of Dinapoli indicators set, or Elder, there are much examples. What they search for robust indicators which do not produce tremendously different results by small changes in their parameters.

The core idea is to train the mind the relationship between the market and the indicator values on the most deep unconscious level by following some basic framework rules. It is the mind that does the job (transforming the indicator input into actionable trading signals) not the indicators.

In fact this works like training a neural network and this takes a lot of time. It is difficult because humans have many psychological limitations. That is why the education is not only intellectual but also on the emotional level the so called emotional intelligence.

And that can be achieved by human by looking at the same indicators again and again. It is advisable not to have much more than 3 indicators at all.

14.02.2013 г.

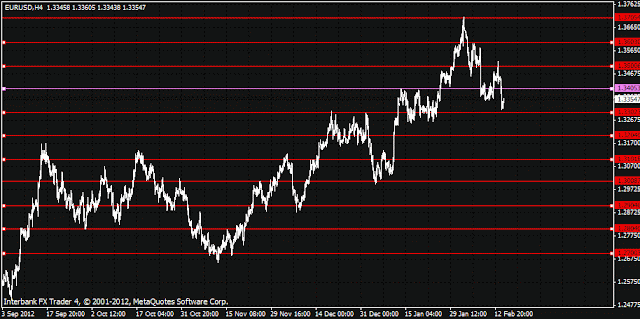
The Forex Grid on EUR/USD

I will post here a screenshot about the Forex grid on EUR/USD. The future support and resistance zones are in the order-books. In order to get the whole idea about support and resistance it is important to have a look in the order books not only at the charts.

The prices very often overshoot the true support and resistance levels and that adds a lot of confusion leading to large errors in support and resistance identification relying only on charts.

The charts are often very misleading with lots and lots of fake technical patterns. Very dangerous are the patterns which rely on projections of volatility like projections of contracting of volatility.

Some of the supports and resistances are related with purely statistical limitations of the current price action.

However the practice is difficult, as the price series are fractal even if you put support and residence in random places you will find matches, and a lot of matches.

The primary support and resistance levels are at round numbers at every 100 pips. 
At every 50 pips are the secondary support and resistance levels.

At the first shot have a look at the Oanda order book.


At the second shot have a look at the EUR/USD chart with plotted horizontal lines at round numbers.


10.02.2013 г.

Weekly EUR/USD analysis: February 11 - 15

Now I am going to be very brief because I really do not want you to think that is a service I will provide.

I think now that we really again we do need to see the daily candle of Monday in order to see what the market will be for the next week.

As for monday there is 50/50 chance that the market will go to 1.33 or to 1.34.

As the market was correcting last week it is hard to predict where the correction will end.I quite agree with the weekly analysis of forexempire that on EURUSD we are in only buy market.

The recent extreme and directional market movements are closely related with fundamental statements and data. One of the main reasons that we fell last week was related with some precise statements by Mario Draghi after the ECB conference 07.02.2012. He warned that the high value of the euro was a risk to growth in the Eurozone.

However as you can remember the euro began its recent sharp rally following positive remarks by ECB head Mario Draghi about the Eurozone economy.

How can you see this. A possible answer is there is some kind of macroeconomic agenda about how fast the Euro should rise and any sharper upside movement is seen as a threat.

For more information go to beathespread.com


6.02.2013 г.

Smooth Commodity Channel Index

Here is a screen shot of a new Smooth CCI mod. I was looking again at the formula of the CCI, Check this mod too. The CCI smooth is a continuation of the previous release.

Here is the formula of CCI:

CCI = (Typical Price - 20-period SMA of TP) / (.015 x Mean Deviation) 

In the previous mod I questionned the constant of 0.015. The CCI was created by Lambert. And he had the idea to use a multiplier 0.015, so as a result 70% to 80 % of the price action would remain within -1oo and +100. However we should focus on what his adea was, and you need to change this number to make fit 70% to 80 % of the price action within the levels -100 and 100.


I think you understand much better this indicator now.However this time we can go one step further and not use a difference between 

Typical Price - 20-period SMA of TP      but something else:

5-period EMA of TP - 20-period SMA of TP for example. In this way you can get much smoother CCI without adding any complexity to the indicator. What counts is that the major turns are without much lag.

And this indicator allows to build different derivative indicators and possibly to smooth them.

The indicator has three settings:

CCI period - this is the CCI period
CCI Period 1 - This is the period used for the moving average period (we use moving average instead of raw price)
level- the level is used to determine how far the indicator line will go above and below zero, basically this is a scaling parameter. The default is of course 0.015.


Download from here, only for registered users.

3.02.2013 г.

Weekly EUR/USD analysis: February 4 - 8

EUR/USD had a strong upward momentum last week and made a substantial 1.3 % climb hitting a 14 month high. Despite the fact that the movement was a textbook break – out from the consolidation area between 1.325 and 1.34, the sharp rise took the majority of the human traders by surprise. The rise trapped many traders. 

From a technical perspective the question is if this pair would show some exhaustion patterns? For this reason the first trading day of the week will be of paramount importance. After such a sharp rise the daily candle of 04.02.2013 will be very important. 

The recent market fluctuations were closely related with the fundamental releases. In the weak ahead many fundamentally important events are scheduled to take place, that would lead potentially to a lot of volatility. 


Trading outlook: 

The trading outlook is difficult this week, the pair is in an uptrend having incredibly strong momentum and fundamentals. This situation is difficult for the majority of human players who are actually trapped in their short positions. 

As the pair is strong not only from technical but also from fundamental perspective the best solution would be to exit at the first correction, in that respect a reversal doji after Monday would be  great news. 

As for the entry in the direction of the trend, I would say that this is difficult if you want to have close stops. 

A break – out above the last week close at 1.37 would be a good break - out entry, and potentially a trade for at least 50 pips up to 1.375. 


Main Weekly Resistence : 1.38

Main Weekly Support :1.34, 1.35